Ops visibility that drives measurable throughput gains
From pick-pack rates in dark stores to table-turn times in restaurants, Slinai converts your existing CCTV into the KPIs your operations team needs — without manual counts, time-study consultants, or invasive sensor rollouts. Benchmark every site from one dashboard, push alerts before SLA breach, and ask plain-language questions of your cameras in real time.
Works with any IP camera · Hikvision · CP Plus · Dahua · ONVIF
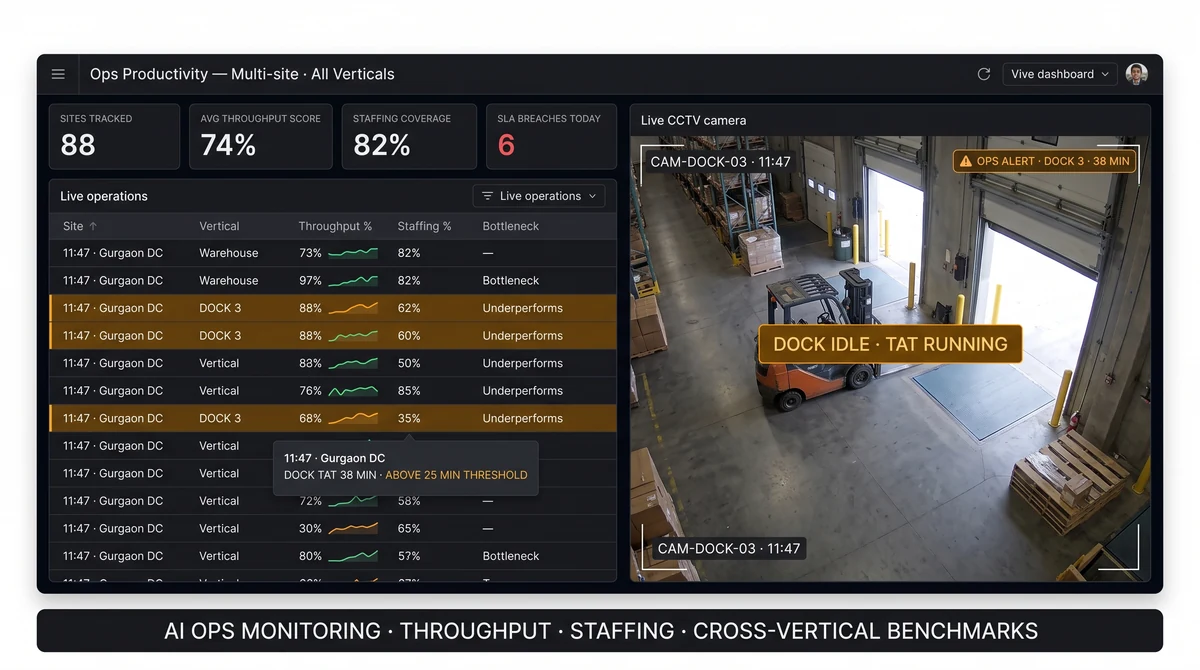
What is operations and productivity analytics?
Operations and productivity analytics uses AI models running on your existing CCTV to measure real-world throughput, staffing coverage, cycle times, and SLA adherence — without manual observation or additional hardware. Slinai converts camera footage into actionable KPIs: pick rate, counter service time, table turn, queue wait, dock turnaround time, prep SLA, and more. These figures update in real time, feed multi-site dashboards, trigger WhatsApp or Slack alerts, and power league tables that benchmark every connected site against its peers — with no self-reporting from site managers required.
Throughput figures based on aggregated outcomes reported by Slinai operators across retail, QSR, dark-store, and logistics deployments. Results vary by industry format, camera placement, and implementation maturity.
What is operations and productivity analytics?
Operations and productivity analytics is the discipline of converting raw operational activity — staff movement, order flow, vehicle turnaround, machine output — into measurable, comparable KPIs that operations teams can act on in real time. Traditional operations management relies on a combination of manual observation, manager self-reporting, and end-of-period data aggregation from POS and WMS systems. Each of these inputs carries a structural lag: the manager sees what they saw during the thirty minutes they were on the floor; POS data arrives after every transaction; WMS data reflects the plan rather than what actually happened on the pick bench or loading dock. The operational reality — the throughput rate right now, the queue depth at this counter, the staffing coverage in this zone — remains invisible until someone manually measures it.
Video-based operations analytics closes this gap by running AI detection models on existing CCTV camera streams to observe, classify, and measure operational activity continuously. A camera positioned over a dark-store pick path does not just record footage — with Slinai's AI layer active, it counts active picks per hour, measures dwell time per zone, and compares today's pace against the rolling seven-day average. A camera covering a QSR service counter measures average service time per transaction, tracks queue depth at five-second intervals, and identifies when the service rate is trending toward SLA breach before the first customer abandons the line. A dock-bay camera measures vehicle occupancy, forklift activity, and manual loading sequences to generate a verifiable dock-turnaround time without relying on driver logbooks or GPS geofencing approximations.
For multi-site operators — retail chains, QSR franchise networks, logistics providers, manufacturing groups — the operational analytics problem compounds with scale. A single well-run flagship site can be managed through supervisor presence and intuition. An estate of 30, 80, or 200 sites cannot. Area managers and HQ operations teams make decisions based on the data that reaches them through manager calls, weekly reports, and periodic audits — all of which are filtered through the self-interest and cognitive load of site-level staff under pressure. Slinai replaces the self-reporting layer with camera-derived evidence that is consistent, comparable, and unaffected by what the site manager chose to include in this week's update.
Slinai's pre-built industry detection packs address this at scale by packaging the AI models, zone configuration templates, and KPI definitions that are most relevant for each operational format. Dark-store operators get pick-rate tracking, idle-dwell detection, and order-to-dispatch SLA monitoring out of the box. QSR operators get service-time measurement, queue analytics, and cover-per-peak-hour tracking. Logistics sites get dock TAT, vehicle classification, and forklift-activity detection. Manufacturing plants get station-level activity classification and line-pause monitoring. Each pack is pre-calibrated for the camera views and layout patterns typical in that format, reducing the configuration work required to go from camera connection to live KPI dashboard.
The strategic value of operations and productivity analytics is not just in the data it produces — it is in the decisions it enables. When a regional operations director can see the bottom 10% of outlets ranked by composite productivity score, benchmark the gap against top performers, and pull a specific clip showing what the service flow looks like at each, the conversation with site management changes from qualitative coaching to evidence-led intervention. Top-site playbooks can be documented and replicated with confidence. Capital investment in staffing, layout changes, and equipment is justified by measured performance gaps rather than estimated ones. Operations and productivity analytics is, at its core, the infrastructure for running evidence-based operations management at scale — from a single connected dashboard, using the cameras you already have.
Ask your cameras anything about operations
Operations managers query live floor status, throughput KPIs, and staffing gaps in plain language — no dashboard navigation, no phone calls to site managers required.
- THROUGHPUT
Real-time throughput tracking
Pick rate, service time, table turn, and dock TAT update in real time from camera feeds — giving operations leaders the floor view they would otherwise get only by being on-site or waiting for end-of-shift summaries.
- BENCHMARK
Multi-site KPI benchmarking
League-table every connected site on composite productivity scores. Bottom-decile locations surface automatically for targeted intervention; top-decile playbooks are documented and pushed to similar-format peers.
- AGENTIC
Agentic operations queries
Ask plain-language questions about any site, any KPI, any time window — and receive camera-backed answers in under 30 seconds without navigating dashboards or calling a site manager.
Which of our dark-store hubs has the lowest pick rate this shift?
Across your 14 active hubs, the lowest pick rate this shift is at Koramangala 2 — currently averaging 24 items per hour against a site average of 38. The drop started at 09:40 and correlates with a zone-congestion flag in Pick Path B. Whitefield Hub is the top performer today at 51 items per hour. Would you like me to pull the live camera view for Koramangala 2?
Walk me through what a service-time SLA alert looks like in Slinai.
When average counter service time at a QSR outlet exceeds your configured SLA — say 90 seconds — Slinai fires a WhatsApp alert to the floor supervisor with the outlet name, counter number, current average service time, and a 60-second clip of the busiest lane. The supervisor taps to view, sees two crew members handling a lengthy customisation order, and redeploys a third crew member from the kitchen — all before the queue depth triggers a customer-visible wait. The alert closes when service time returns within SLA, and the event is logged in the shift compliance scorecard.
What is the average dock turnaround time across our three NCR warehouses this week?
Average dock TAT across your three NCR warehouses this week is 43 minutes — against your 30-minute SLA. Naraina is the outlier at 58 minutes average, driven by Bay 3 which has been consistently over 70 minutes on morning shifts. Okhla and Gurgaon are at 38 and 34 minutes respectively. The Naraina Bay 3 pattern started Monday and aligns with a shift-roster change. I can pull the activity timeline for Bay 3 across the last three shifts if that helps.
Show me the opening compliance status for our South Delhi stores today.
Of your 12 South Delhi outlets, 10 opened within the 5-minute window of their scheduled opening time. Saket Mall and Kalkaji did not — Saket opened 22 minutes late and Kalkaji opened 18 minutes late. I've clipped the door-open events for both. Kalkaji had no staff visible on camera at scheduled opening time; Saket had staff present but the shutter mechanism appears to have delayed the opening. I've flagged both to your area manager's alert queue.
Which manufacturing line had the most idle time yesterday?
Line 4 in your Pune plant had the highest idle time yesterday — 47 minutes of classified idle across the 7 AM–3 PM shift, representing 9.8% of available production time. The main idle windows were 09:12–09:31 (19 minutes) and 13:44–13:58 (14 minutes). The 09:12 window correlates with a material feeder station in Zone C going inactive. Line 2 was the most productive with only 11 minutes idle. Would you like me to surface the station-level activity clips for Line 4?
Every productivity metric your operations team needs
Pre-built detection packs for retail, quick-service restaurants, dark stores, cloud kitchens, logistics, and manufacturing — calibrated AI models for the camera views and layout patterns typical in each format.
Staff coverage heat maps
See where floor coverage thins by hour, zone, and shift. Match staffing plans to actual traffic patterns instead of intuition — and catch coverage gaps before customers or pickers notice them.
Throughput & cycle-time analytics
Measure real throughput — pick rate, counter service time, table turn, order-to-dispatch — from camera data without manual observation, time-study visits, or floor-mounted sensors.
Queue and wait-time intelligence
Track queue depth and customer wait at counters, checkout lanes, and collection points. Alert staff before the queue hits your defined SLA threshold — every shift, every site.
Agentic ops AI
Ask "which station is slowest right now?" or "how many orders are queued in the kitchen?" and get a camera-backed answer in seconds. No dashboard navigation or report pull required.
Opening & closing compliance
Detect early closures, late openings, and missed pre-open checklists automatically — across every site, every day — without calling each store manager or relying on self-reported confirmation.
SOP adherence scoring
Score station coverage, rotation discipline, and process compliance per shift against your defined SOPs. Replace clipboard audits with camera-derived evidence that every shift leaves a verifiable record.
Real-time productivity alerts
Push WhatsApp, Slack, or email alerts when throughput drops, a station goes unstaffed, dispatch SLA approaches breach, or a KPI falls outside defined thresholds — before the impact compounds.
Footfall-to-productivity proxies
Connect footfall data with POS transaction counts to surface sales-floor productivity gaps invisible from till data alone. Identify when high-traffic periods are lost to understaffing rather than low intent.
Multi-site KPI benchmarking
League-table every site on throughput, wait time, and SLA compliance from a single dashboard. Expose the bottom 10% of locations for targeted intervention and roll top-site playbooks to peers.
Zone utilisation heat maps
Identify idle space and congested pathways throughout the shift. Use heat-map evidence to redesign layouts, reposition stations, and restructure rosters from objective data rather than anecdote.
Dispatch & handoff SLA tracking
Track order-to-dispatch or pick-to-handoff times with camera-derived timestamps. Alert on SLA creep the moment the window starts narrowing — not after the late-delivery complaint arrives.
Shift coverage verification
Confirm staff-to-plan ratios at opening, peak hours, and close across all sites — without calling site managers or waiting for workforce management system self-reports.
See operations & productivity analytics for multi-site businesses on your cameras
Book a walkthrough — we'll map detections, alerts, and dashboards to your sites.
How Slinai connects your cameras to live KPIs
From RTSP stream connection to multi-site productivity dashboard in under two weeks — with no new hardware, no floor sensors, and no time-study consultants.
- 1
Connect existing cameras
Slinai connects to your current NVRs and IP cameras via RTSP or ONVIF — Hikvision, CP Plus, Dahua, Axis, ONVIF. Typical single-site stream connection takes one day.
- 2
Select your industry detection pack
Choose the pre-calibrated bundle for your format — retail, QSR, dark store, cloud kitchen, logistics, or manufacturing — with pre-configured zone types and throughput metrics.
- 3
Calibrate zones & thresholds
Draw counting lines, station polygons, and queue zones per camera view. Set SLA thresholds per KPI per site — Slinai's team validates accuracy during a two-week UAT.
- 4
Go live on dashboards & alerts
Productivity KPIs populate the multi-site dashboard from day one. Configure WhatsApp, Slack, or email alert routing by role — store, area manager, and HQ receive the right signals.
- 5
Benchmark & improve
Use weekly league tables to identify the bottom 10% of performers. Bring top-site playbooks to similar-format locations. Re-tune thresholds as operations mature.
Know your pick rate before the last-mile partner does
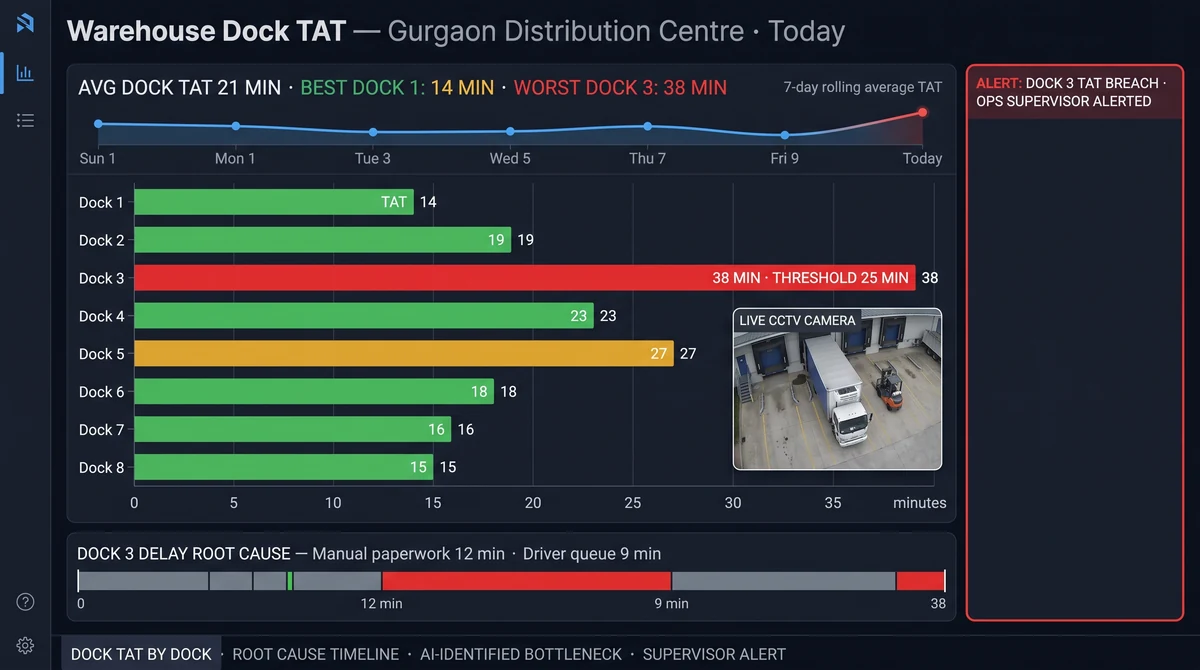
Dark-store operators typically measure picker productivity through shift-end order counts — a figure that arrives hours after the slow session that caused the late-delivery spike. Slinai tracks active picking time, idle dwell, and pack-station throughput from camera data in real time. Ops leads get the signal to redeploy pickers before SLA breach — not in the post-mortem.
A multi-city quick-commerce operator reduced order-to-dispatch time by 22% after identifying that three of its twelve pick paths were consistently congested during the 6–9 p.m. window. No sensor installation was required. The cameras already covering the fulfilment floor provided the entire data feed — Slinai added zone calibration and activity classification on top.
Q-commerce hub reduces order-to-dispatch time by 22%
A multi-city quick-commerce operator running 12 fulfilment hubs was absorbing late-delivery penalties from its aggregator partners without a clear understanding of where in the pick-to-dispatch workflow the time was being lost. Shift-end order counts told the team that productivity was inconsistent — but not which path, which zone, or which hour was responsible. Slinai's pick-path congestion analytics identified three specific corridors running consistently above 85% occupancy during the 6–9 PM window, causing idle-dwell cascades that pushed order-to-dispatch past the SLA threshold. A zone layout adjustment and staggered picker assignment resolved the congestion without additional headcount, reducing average order-to-dispatch by 22% across those hubs within six weeks.
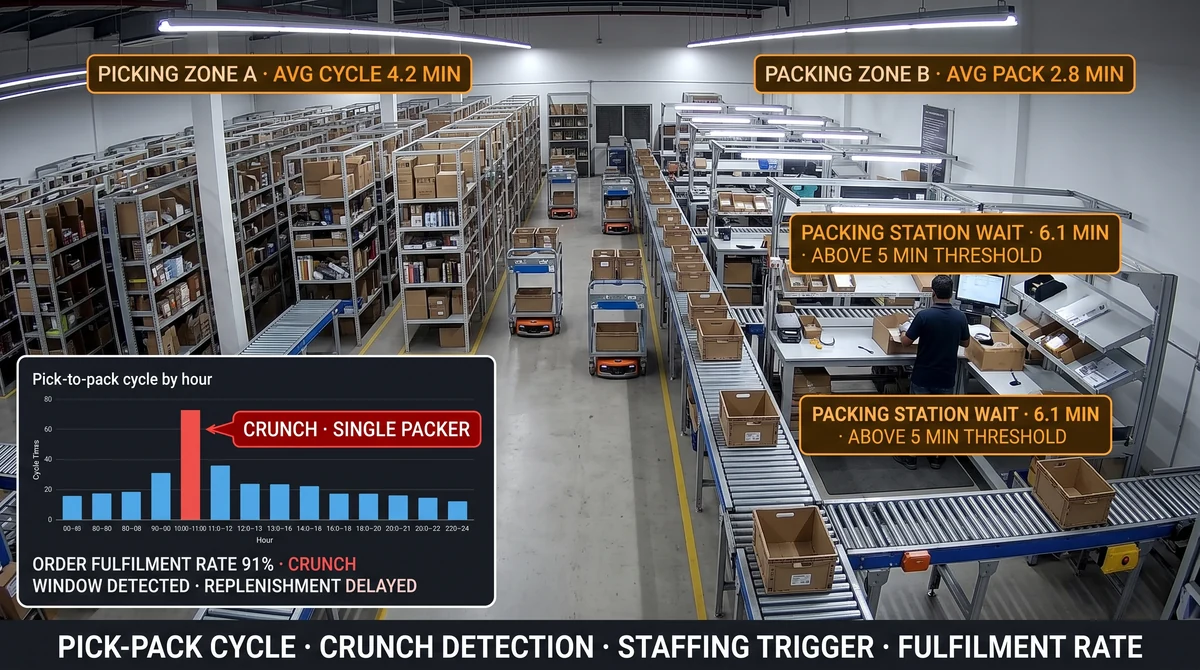
Dock turnaround visibility — from cameras, not driver logbooks
Dock TAT is one of the hardest logistics KPIs to collect honestly. Self-reported arrival and departure times drift from reality; GPS geofencing captures vehicle arrival but misses loading time; driver app check-ins require compliance that is rarely enforced consistently. Slinai reads dock bay occupancy, forklift activity, and manual loading from camera feeds — producing a verifiable TAT record without changing how drivers or loaders work.
A regional 3PL network discovered its average dock TAT was 47 minutes against a 30-minute SLA — a gap that driver logs had masked for two quarters. Dock-by-dock camera analytics surfaced the two bays responsible for 80% of overruns, tracing the root cause to a single loading checklist step skipped on nightshifts. The fix was operational, not infrastructure: a nightshift supervisor briefing and a revised bay assignment sequence.
Regional 3PL closes 17-minute dock TAT gap without hardware changes
A regional 3PL network operating three fulfilment hubs had been reporting a 30-minute dock TAT SLA to its retail clients for two consecutive quarters — a figure sourced from driver app check-ins that the operations team increasingly suspected was optimistic. Slinai dock-bay analytics revealed the actual average was 47 minutes, with two of seven bays responsible for 80% of the overrun. The root cause was a loading checklist step — pallet wrap confirmation — being skipped on nightshifts when the duty supervisor was not physically present at the bay. A targeted briefing and a bay assignment sequence change brought average TAT to 31 minutes within three weeks, resolving a client SLA dispute and averting a contract review.
Ready to improve operations & productivity analytics for multi-site businesses?
Tell us about your sites — we'll map operations & productivity analytics for multi-site businesses to your cameras.
Line output visibility without embedding sensors on every workstation
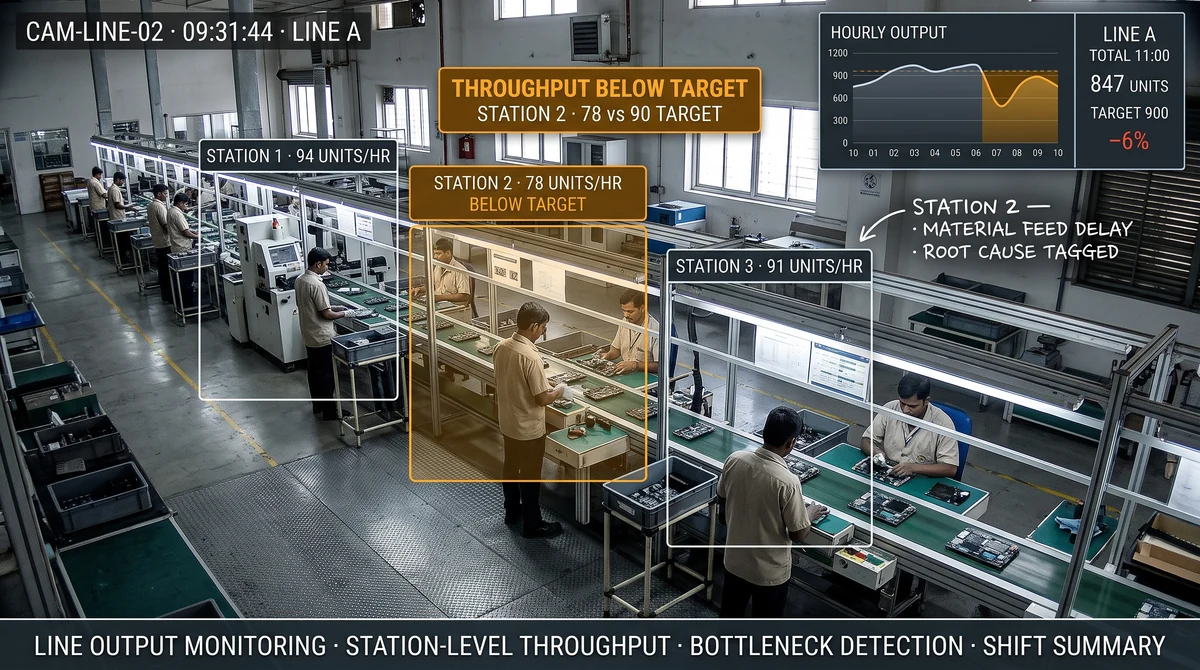
Production managers typically learn about output shortfalls at shift end — when the hour-by-hour production log is tallied against plan. By then, the idle time has already been lost and the shift cannot be recovered. Slinai detects activity at each station, counts line pauses, and flags extended idle periods in real time. Floor supervisors receive alerts when a station goes quiet beyond the configured idle threshold — whether the cause is a material shortage, equipment pause, or an unplanned break.
An FMCG packaging line reduced unplanned idle time by 31% in the first two months after converting end-of-shift variance analysis into real-time station-level alerts. No additional hardware was installed — the cameras already positioned for safety monitoring became the throughput data source with AI-based activity classification layered on top.
FMCG packaging line cuts unplanned idle time by 31% in two months
An FMCG packaging line running three eight-hour shifts was experiencing a persistent gap between planned and actual output that production managers attributed to equipment variability. Shift-end variance reports indicated 8–12% of production time was being lost to unplanned pauses, but the logs did not isolate which stations, which shifts, or which hours were responsible. Slinai's station-level activity classification identified that the primary idle concentration was at a single labelling station during the first 20 minutes of each shift — a pattern consistent with a slow warm-up routine rather than equipment failure. A shift-start SOP change and a real-time idle alert for any station exceeding 8 minutes of inactivity reduced total unplanned idle time by 31% within two months of go-live.
Ready to improve operations & productivity analytics for multi-site businesses?
Tell us about your sites — we'll map operations & productivity analytics for multi-site businesses to your cameras.
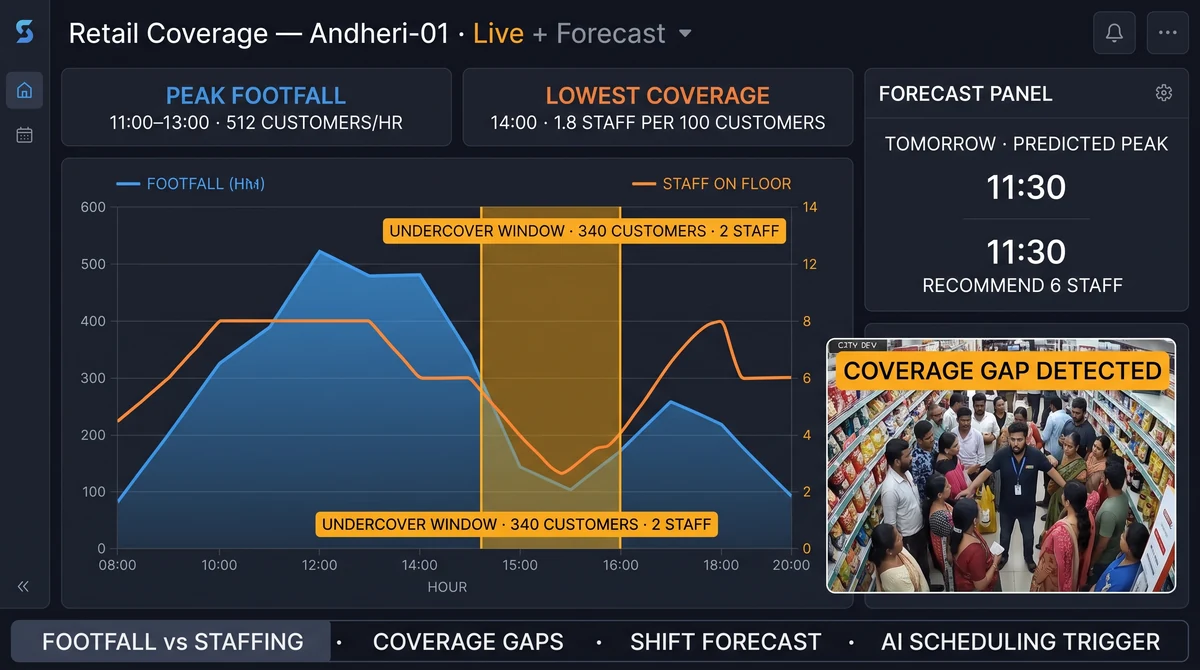
Staff the floor where footfall goes, not where yesterday's roster was written
Most retail staffing plans are built on intuition, last season's patterns, and manager familiarity with their store. Slinai correlates live footfall with zone-level coverage — showing which areas are understaffed relative to traffic and when the checkout queue begins building before the next scheduled shift change. Area managers see the cross-site picture; store managers see their own floor in real time.
A mid-size general-trade retailer redistributed floor coverage by 15% after mapping footfall heat against zone staffing throughout the trading day. Checkout wait times fell and units-per-transaction rose in the redeployed zones — with no additional headcount hired. The redeployment decision was made from dashboard data rather than from a time-and-motion consultant's report.
General trade retailer improves coverage without additional headcount
A mid-size general-trade retailer operating 22 outlets across two states was carrying checkout wait times of 6–9 minutes during peak trading hours despite maintaining the same headcount per shift across all stores. Exit interviews flagged queue frustration as a leading reason for basket abandonment, but store managers attributed the problem to inadequate staffing budgets. Slinai's footfall-to-coverage correlation revealed that the understaffing was not uniform — it was concentrated in specific zones and specific time windows while other floor areas were overstaffed relative to traffic. A 15% redeployment of floor coverage — no new hires, just a revised zone assignment protocol — reduced peak checkout wait times by 40% across pilot outlets and increased units-per-transaction in the redeployed zones.
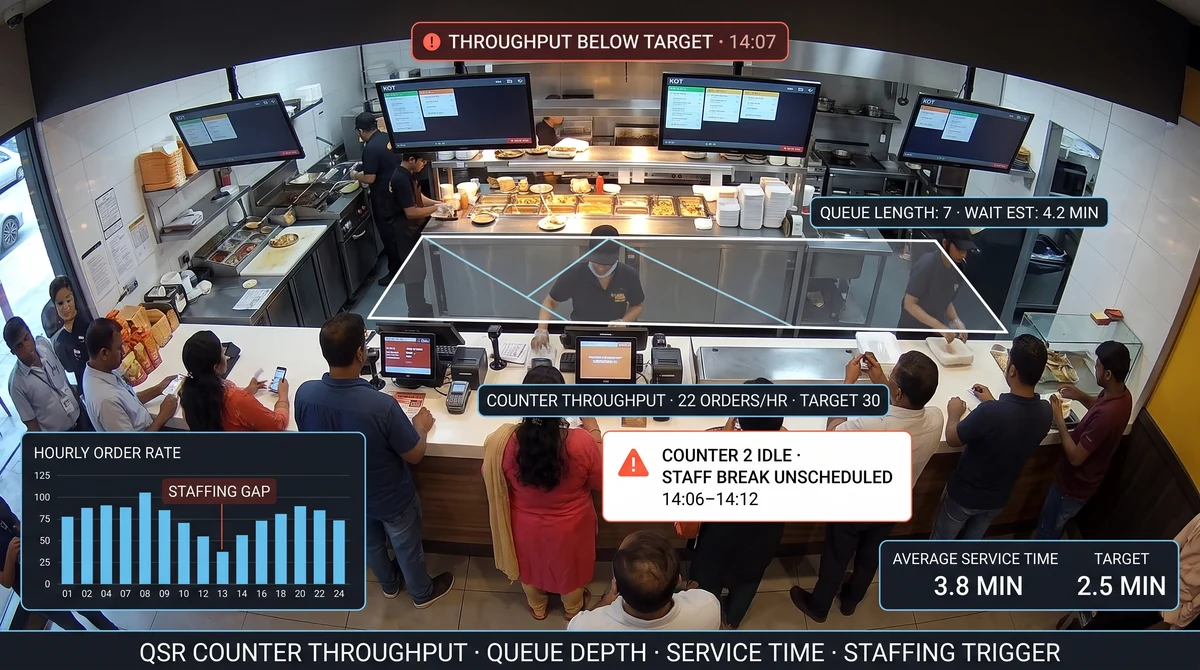
More covers per peak hour — from counter analytics, not mystery shopping
Counter throughput in quick-service restaurants is the difference between a profitable peak session and a revenue hour lost to avoidable wait. Slinai tracks customers served per hour, average service time, queue depth, and counter abandonment — all from existing CCTV, without requiring POS integration (though pairing with POS adds transaction-level context to every service time measurement).
A QSR chain running 40+ outlets found three locations were losing an average of 12 covers per peak hour because crew were not initiating counter service within the 45-second target. Camera-based service-time analytics surfaced the gap; retraining resolved it within one week. Mystery-shopping programmes had not flagged those same outlets in the prior quarter — because mystery shoppers visit infrequently and crews behave differently when observed.
QSR chain recovers 12 covers per peak hour at three underperforming outlets
A QSR chain operating 40+ outlets had a mystery-shopping programme that reviewed each location quarterly — a cycle too infrequent to catch service-time drift before it compounded over a full peak season. Slinai service-time analytics running continuously on existing kitchen and counter cameras identified three outlets where crews were averaging 75–82 seconds per transaction during peak hours against a 45-second brand standard. The outlier pattern was consistent across multiple peak sessions and multiple crew members — indicating a training or SOP gap rather than individual performance. A single retraining session at each outlet, anchored by the camera-derived service-time distribution charts, brought all three back within standard within one week. The recovered 12 covers per peak hour at each location translated directly to measurable revenue recovery across the campaign period.
Ready to improve operations & productivity analytics for multi-site businesses?
Tell us about your sites — we'll map operations & productivity analytics for multi-site businesses to your cameras.
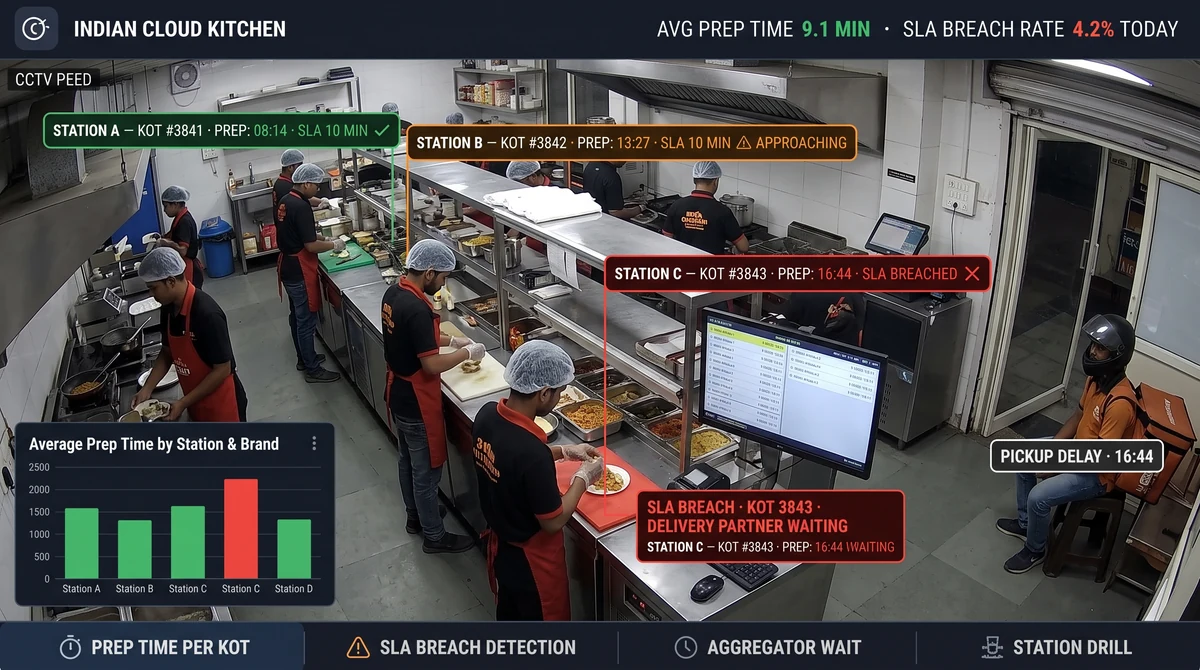
Prep SLA from order received to bag sealed — visible on camera
Aggregator platforms penalise cloud kitchens for late dispatch and high cancellation rates — yet most operators cannot pinpoint exactly where prep time bleeds away between order received and bag sealed. Slinai maps the kitchen workflow step by step: order station to prep bench to packaging to collection zone. Each stage's average duration becomes visible; delays trigger alerts before the aggregator's SLA clock expires rather than after the cancellation is already logged.
A multi-brand cloud-kitchen hub reduced its aggregator cancellation rate by 34% after Slinai identified that packaging stations were routinely understaffed during the 11 a.m.–2 p.m. rush, creating a three-minute bottleneck that pushed orders past the 20-minute dispatch window. The fix was a roster change and a station layout adjustment — not a hardware purchase or a new WMS subscription.
Multi-brand cloud kitchen cuts aggregator cancellations by 34%
A multi-brand cloud-kitchen hub operating eight brands out of a shared kitchen in Hyderabad was facing an escalating aggregator cancellation rate that the platform attributed to preparation delays. The hub manager suspected understaffing but had no data to show which station, which brand, or which time window was responsible for the SLA breaches. Slinai's prep-stage breakdown analytics identified that packaging stations for three high-volume brands were running at 60% of required throughput between 11 AM and 2 PM — a bottleneck that added an average of three minutes to those brands' order-to-dispatch times, consistently pushing orders past the platform's 20-minute dispatch window. A roster change adding one packaging team member per brand during the lunch window, plus a station layout adjustment reducing walking distance between prep and packaging, resolved the bottleneck within two weeks.
Ready to improve operations & productivity analytics for multi-site businesses?
Tell us about your sites — we'll map operations & productivity analytics for multi-site businesses to your cameras.
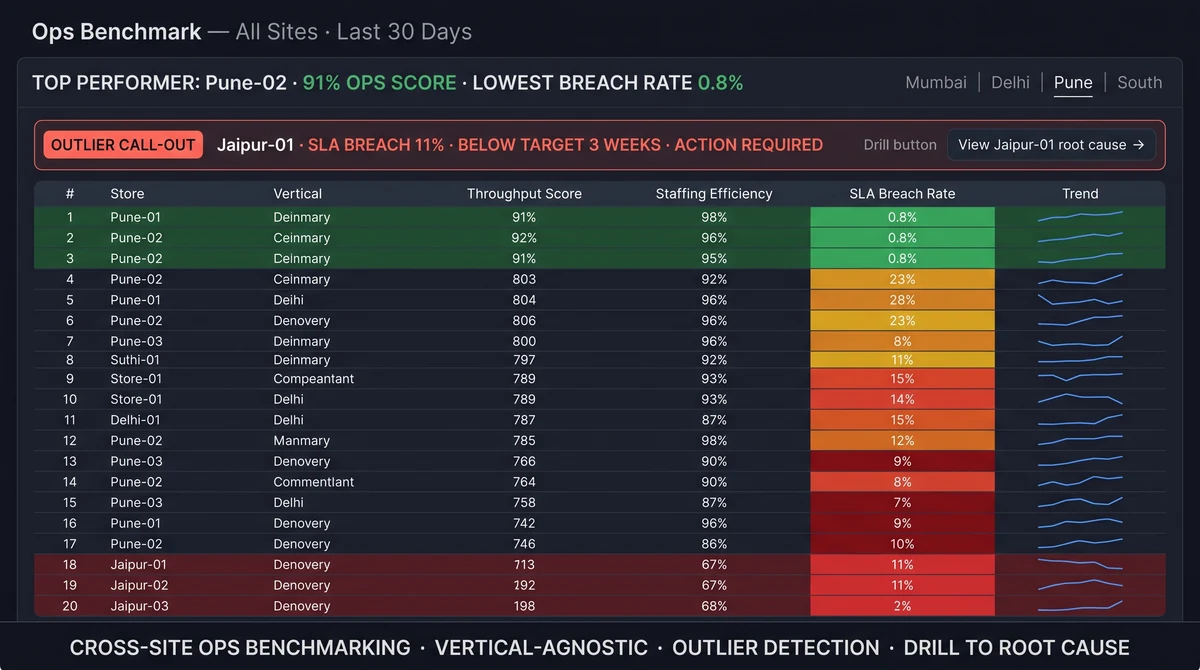
Benchmark your worst sites against your best — with camera evidence, not manager reports
Regional and HQ operations teams spend hours each week assembling performance data from site managers who have every structural incentive to report optimistically. Slinai feeds a single dashboard with camera-derived KPIs — throughput, staffing coverage, queue wait, SLA compliance, and SOP adherence — across every connected location. No self-reporting, no consolidation spreadsheets, no waiting for the Monday morning call.
A regional franchise group operating 80+ outlets created weekly league tables from Slinai data — ranking sites on a composite productivity score drawn from counter service time, opening compliance, and shift coverage verification. The bottom-decile outlets received structured intervention plans and improved by an average of 19% within six weeks. Top-decile playbooks were documented and rolled to similar-format sites in the following quarter.
Franchise group improves bottom-decile outlets by 19% in six weeks
A regional franchise group operating 80+ QSR and casual-dining outlets across three states had been running quarterly operational reviews that relied on area manager reports, mystery-shopping scores, and end-of-period POS comparisons. The group's operations director described the data as 'too old to act on and too aggregated to pinpoint.' After connecting Slinai across the estate, the team created a weekly composite productivity league table drawing on camera-derived service time, opening compliance, and shift coverage data. The bottom 10% of outlets — eight locations — received structured coaching conversations anchored by specific clip evidence rather than general feedback. All eight improved their composite score by an average of 19% within six weeks. Top-decile playbooks documented from the best-performing sites were formalised and pushed to similar-format locations in the following quarter.
Ready to improve operations & productivity analytics for multi-site businesses?
Tell us about your sites — we'll map operations & productivity analytics for multi-site businesses to your cameras.
Ask your cameras what is happening on the floor — in plain language
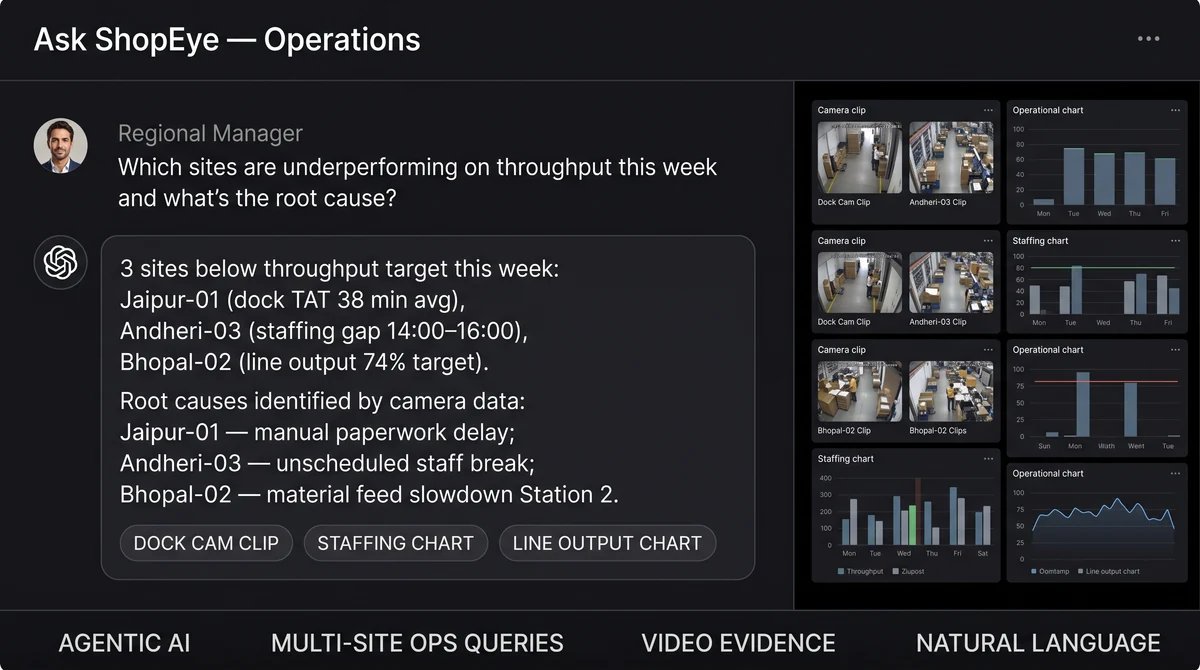
Scheduled reports tell operations teams what happened last week. Slinai's agentic AI layer answers what is happening right now. Operations managers ask questions in plain language — "which site has the highest counter wait time today?", "how many pickers are active on the second floor?", "did this location complete its opening checklist?" — and receive camera-backed answers in seconds without navigating dashboards, exporting CSVs, or calling a site manager.
Ops managers who pilot conversational AI access consistently identify that the questions they ask most frequently are the ones that previously required calling a store, waiting for a WhatsApp reply, and hoping the answer was accurate. Agentic AI closes that loop without the phone call — and because the answer comes from camera evidence rather than self-report, it is verifiable by design.
Operations team eliminates Monday morning site-status calls
A national QSR group's operations team ran a weekly Monday morning call ritual — 45 minutes with all 12 area managers, consolidating weekend performance data, opening compliance status, and any notable incidents from each region. The call was widely acknowledged as inefficient but structurally necessary because no single system held the complete picture. After deploying Slinai's agentic AI layer across the estate, the operations director began each Monday by querying the AI for weekend KPI summaries, opening compliance status, and bottom-quartile site flags — receiving camera-backed answers in under three minutes. The 45-minute call became a 15-minute exception review focused on the three or four sites that required actual discussion. Area managers spent the reclaimed time on site visits and coaching rather than on report preparation.
Ready to improve operations & productivity analytics for multi-site businesses?
Tell us about your sites — we'll map operations & productivity analytics for multi-site businesses to your cameras.
Operations analytics for every industry
Pre-built detection packs calibrated for the camera views, zone layouts, and KPI definitions most relevant to each operational format — from dark stores to dock bays.
Dark stores & Q-commerce hubs
- Real-time pick-rate tracking by zone and shift
- Idle-dwell detection on active pick paths
- Order-to-dispatch SLA monitoring with breach alerts
- Pack-station throughput measurement and congestion flags
- Multi-hub productivity league table for city-cluster benchmarking
QSR & restaurants
- Counter service-time measurement per shift and per station
- Covers-per-peak-hour tracking with abandonment detection
- Queue depth and wait-time SLA alerting
- Table-turn timing for dine-in formats
- Kitchen throughput stage tracking from order to dispatch
Retail stores
- Footfall-to-staff-coverage correlation by zone and hour
- Checkout queue wait-time monitoring and alert
- Opening and closing compliance verification across estate
- Peak-hour understaffing detection and redeployment signal
- Units-per-transaction context from footfall-to-POS pairing
Logistics & warehousing
- Dock TAT measurement from vehicle arrival to departure
- Bay-by-bay turnaround comparison and SLA breach alerts
- Forklift activity classification and idle-period detection
- Shift coverage verification at dock gates and loading areas
- Dispatch handoff audit with camera-verified timestamps
Manufacturing & assembly
- Station-level activity classification and idle-time tracking
- Line-pause detection with real-time supervisor alerts
- Shift output variance against plan with camera evidence
- Workstation coverage confirmation during shift changeovers
- Pre-shift compliance verification for SOP-critical setups
Cloud kitchens & ghost brands
- Order-to-dispatch stage breakdown from order station to collection
- Packaging station throughput and understaffing detection
- Aggregator SLA breach prediction from prep-stage analytics
- Multi-brand station monitoring from a single shared kitchen
- Peak-hour bottleneck identification and roster signal generation
Call us now — or book a live walkthrough
Share your camera count and sites. We'll show detections on sample footage from your industry.
Operations analytics: with Slinai vs without
The operational intelligence gap between relying on manager self-reports and receiving real-time, camera-derived KPIs across your estate.
| Capability | Without Slinai | With Slinai |
|---|---|---|
| KPI data latency | End-of-shift or end-of-day reports from site managers — typically 8–24 hours after the operational issue occurred and the shift cannot be recovered | Real-time KPI updates from camera-derived detection — pick rate, service time, and queue depth available within seconds of the operational window |
| Throughput measurement accuracy | Manual observation, time-and-motion studies, or manager estimates — infrequent, expensive, and subject to Hawthorne effect during observation windows | Continuous AI detection running on existing cameras across every shift — 90–95% accuracy after calibration with no observation effect on staff behaviour |
| Multi-site visibility | Weekly Monday morning calls, area manager reports, and periodic audits — with no normalised view across formats, cities, or operational types | Single dashboard with camera-derived KPIs across all connected sites — normalised by format, rankable by composite productivity score, updated daily |
| SLA breach response | Discovered after the breach has accumulated — from end-of-day reporting, customer complaints, or aggregator penalty notices | Pre-breach WhatsApp alert to the relevant supervisor when a KPI trends toward the configured SLA threshold — while the shift can still be adjusted |
| Staffing decisions | Based on last season's roster patterns, manager intuition, and headcount norms — with no real-time data on where coverage gaps exist relative to actual traffic | Footfall-to-coverage correlation showing exactly which zones are understaffed by time of day — enabling redeployment decisions without additional headcount |
| Bottom-site intervention | Identified through quarterly audit, LP visit, or a notable customer complaint — typically weeks after the performance gap has been accumulating | Weekly league-table surfacing the bottom 10% of sites automatically — with clip evidence to anchor coaching conversations and track improvement over time |
| Dock TAT measurement | Driver logbooks, GPS geofencing, or app check-ins — all subject to entry error, compliance gaps, or measurement lag that masks the true loading time | Camera-derived timestamps from vehicle arrival to departure — bay-by-bay, shift-by-shift, without requiring any change to how drivers or loaders work |
| Opening compliance tracking | Self-reported confirmation from store managers via WhatsApp or email — with no independent verification and significant reporting variability across the estate | Camera-verified door-open events compared against scheduled opening times — automated compliance rate per site, per week, with late-open alerts in real time |
| Hardware investment | Dedicated people-counters, floor sensors, IoT throughput trackers, or time-study consultant engagements — each requiring procurement, installation, and maintenance | Works on existing IP cameras via RTSP or ONVIF — no new hardware, no floor installations, no consultant engagements required to get live KPIs |
Operations analytics for Indian retail, QSR, logistics, and food-service businesses
India's multi-site operators face an operations management challenge that is structurally different from the contexts in which most Western enterprise software was designed. Store networks expand rapidly across Tier 2 and Tier 3 cities where experienced area managers are scarce and site-level operational data quality is variable. QSR franchise networks run hundreds of outlets under a single brand standard with limited corporate compliance staff per region. Logistics networks serve e-commerce demand surges with dock and fulfilment throughput requirements that shift weekly. Manufacturing plants compete on per-unit cost in categories where a 5% efficiency improvement is the margin difference between a viable contract and a lost one. Slinai is built for this operating reality — purpose-designed to connect to the mixed-vendor camera infrastructure already installed across Indian commercial sites and deliver the KPIs that Indian operations teams actually use, in the channels they actually work in.
WhatsApp is not a convenience feature for Indian operations teams — it is the primary communication channel through which store managers, area supervisors, shift leads, and regional directors coordinate every day. Slinai's alerting layer is WhatsApp-first: throughput breach alerts, SLA warning notifications, and opening-compliance flags route to the WhatsApp number or group already used by the recipient role, with templates available in both English and Hindi. An area manager covering 12 outlets across NCR does not log into a web dashboard to see that Lajpat Nagar opened 18 minutes late — the alert arrives on their phone alongside the clip evidence, in the same thread where they already manage their sites. This is not a UX preference; it determines whether operational alerts receive real-time responses or accumulate unread in a platform no one checks between review meetings.
The Digital Personal Data Protection Act (DPDP Act, 2023) introduces compliance considerations for workplace camera monitoring that Indian operations teams must factor into their technology decisions. Slinai's productivity analytics platform is designed with DPDP-aligned principles: detection zones focus on operational KPI measurement — counter throughput, zone utilisation, dock activity — rather than on individual employee identification. Role-based access controls scope dashboard and footage access to authorised personnel with a defined operational function. Configurable data retention periods allow operators to set archiving windows that match their compliance documentation requirements rather than defaulting to maximum storage. India-region hosting options are available for organisations that require data residency within the country's borders for DPDP compliance. Slinai's onboarding documentation includes guidance for operators establishing employee monitoring disclosure practices aligned with DPDP principles.
Turn your existing cameras into an operations intelligence layer
Slinai connects to your current CCTV in days, not months. Our implementation team will map detection zones and KPI thresholds to your estate and show you live throughput data before you commit.
Employee privacy and DPDP compliance in operations monitoring
Operations and productivity analytics involves continuous camera monitoring of workplaces, which intersects with employee privacy interests under India's DPDP Act 2023 and general principles of proportionate workplace surveillance. Slinai's operations analytics is designed around KPI measurement rather than individual employee tracking: detection zones classify activity types — active picking, idle dwell, station occupancy — without building per-person records of movement patterns across a shift. Throughput metrics are aggregated at zone and station level; individual staff members are not identified by name or biometric signature in standard productivity analytics workflows.
Access controls in Slinai's operations platform are role-scoped: store managers see their own site's KPI data; area managers see their region; HQ operations teams see the normalised multi-site view. Raw footage access is restricted to authorised roles with a documented operational purpose — LP investigation, compliance audit, or performance review — and every footage access event is logged with user ID and timestamp. Slinai recommends that operators include camera monitoring disclosure in employment agreements and post visible camera notices at monitored locations. The platform's onboarding documentation provides templates aligned with DPDP disclosure best practices to reduce the compliance preparation burden for operations teams deploying productivity monitoring for the first time.
Questions teams ask about operations & productivity analytics for multi-site businesses
What is operations and productivity analytics in the context of CCTV?
Operations and productivity analytics uses AI models running on your existing CCTV cameras to measure real-world throughput, staffing coverage, cycle times, and SLA adherence without manual observation or sensor hardware. Slinai converts camera footage into measurable KPIs — pick rate, service time, table turn, queue wait, dock TAT, and more — that update in real time and feed dashboards, alerts, and multi-site benchmarks. The cameras you already have become the data source; Slinai adds the intelligence layer on top.
Which industries can use Slinai's operations analytics?
Slinai has pre-built detection packs for retail, quick-service restaurants, dark stores and quick-commerce, cloud kitchens and ghost brands, logistics and warehousing, and manufacturing and assembly. Each industry has a distinct set of productivity metrics — pick-pack rate for dark stores, counter service time for QSR, dock TAT for logistics, prep SLA for cloud kitchens, line output for manufacturing — with AI models calibrated for the camera views and layout patterns typical in each format. Consumer-service branches and education campuses can also use staffing coverage and queue analytics from the same platform.
Does Slinai require new cameras, sensors, or floor hardware?
No. Slinai connects to existing IP cameras and NVRs via RTSP or ONVIF — Hikvision, CP Plus, Dahua, Axis, and any ONVIF-compliant device. No floor sensors, people counters, badge readers, or new cameras are required. Camera placement and image quality affect AI accuracy; Slinai's implementation team surveys sites during onboarding and advises on any repositioning that would materially improve detection confidence.
How is this different from workforce management or WMS software?
Workforce management and WMS systems tell you what the plan said should happen — shifts scheduled, orders allocated, routes assigned. Slinai tells you what actually happened on the floor: whether the shift arrived on time and at full strength, whether pickers were actively picking or idle, whether the loading crew achieved the TAT your SLA requires. The two data sources complement each other — Slinai can feed verified actuals into a WMS, ERP, or BI tool via API, turning the plan-vs-actual gap from a retrospective exercise into a real-time signal.
How accurate are camera-based throughput measurements?
Typical throughput counts — people, items, vehicle occupancy, station activity — achieve 90–95% accuracy after site calibration in standard lighting and camera placement conditions. Slinai runs a UAT period with your operations team before production alerting begins, tuning detection thresholds per site to reduce false positives. Accuracy figures are shared transparently during onboarding; sites where camera angle or lighting materially limits confidence are flagged before go-live.
Can Slinai integrate with our POS, WMS, or ERP?
Yes. Slinai's Data and integrations layer supports POS, WMS, and third-party API connections. When enabled, camera-derived KPIs sit alongside transaction data — linking, for example, checkout service time to basket size, or pick productivity to order accuracy rate. API access and scheduled webhook or CSV exports push camera-derived KPIs to downstream systems without requiring a custom integration project in most cases.
What does agentic AI mean for operations teams in practice?
Agentic AI is Slinai's conversational intelligence layer. Instead of navigating dashboards and pulling reports, operations managers ask questions in plain language — "which site has the longest queue right now?", "how many pickers are active on shift two?", "did all locations complete opening today?" — and the AI retrieves evidence from live camera feeds to answer. It can compare sites, flag exceptions across the fleet, or summarise a period without the user needing to specify which cameras or time windows to review. The practical effect is that questions that previously required calling a site manager are answered in under 30 seconds from camera evidence.
How long does onboarding take for a multi-site rollout?
Typical single-site onboarding is 5–10 business days: site survey, stream connection, zone calibration, detection tuning, and two-week UAT. Multi-site rollouts use zone calibration templates across similar-format locations — a chain of standardised store formats can add subsequent sites in 2–3 days each after the first site is fully validated. Rollouts of 10–20 similar-format sites typically complete within 4–6 weeks from project kickoff to all-sites go-live.
Can I benchmark sites against each other on productivity KPIs?
Yes. Slinai's multi-site dashboard normalises KPIs across all connected sites so like-for-like comparison is valid even when sites differ in size or format. Area managers see their region; HQ sees all regions. League tables, bottom-10% outlier flags, and composite productivity scores are built into the standard dashboard. Filters by city, format type, and time period let you segment comparisons meaningfully — a dark-store league table is separate from a retail-floor one, even within the same account.
What happens when a productivity KPI falls below its target threshold?
Slinai sends an alert via WhatsApp, Slack, or email with a clip or snapshot attached. Thresholds are configurable per site, per shift, and per KPI — a dark store might alert when pick rate drops below 30 items per hour, while a QSR might alert when service time exceeds 90 seconds. Alert routing splits by role: store managers receive their own site's alerts; area managers receive their region's exceptions; HQ receives cross-site escalations. Alerts link directly to the relevant camera view so the recipient can verify context before acting.
How does Slinai handle multiple shifts and shift-change handovers?
Shift windows are configurable per site. KPIs are tracked within each shift window and summarised at shift change — so ops leads can identify whether a productivity issue is specific to a single shift or persistent across all shifts at a site. Handover periods, when coverage typically dips, can be monitored separately with narrower alert thresholds. Shift-level scorecards let operations teams identify which shift is underperforming, not just which site, before making staffing or training decisions.
Can KPI data be exported to Power BI, Looker, or our own BI tool?
Yes. Scheduled CSV exports and API access via the Data and integrations layer push camera-derived KPIs to Power BI, Looker, Tableau, Google Sheets, or any custom analytics stack. Real-time webhook feeds are available for downstream alerting and WMS integration. Slinai does not require you to run analytics only inside its own platform — the data layer is designed to be connectable from the start.
Does operations analytics work on edge-deployed or bandwidth-constrained sites?
Yes. Slinai's edge deployment model processes AI detections locally on an on-prem node, then syncs only KPI metadata, alert clips, and throughput summaries to the cloud dashboard — keeping sites visible even when available uplink is under 2 Mbps. Edge sites appear in the same multi-site productivity dashboard as cloud-native sites; area managers see a unified view without needing to know which sites are edge-deployed.
Keep exploring
Industries
- Dark stores
Pick-pack productivity, dispatch SLA
- Restaurants & QSR
Kitchen hygiene, queues, POS oversight
- Retail video analytics
Footfall, conversion, loss prevention
- Logistics & warehouses
Dock TAT, PPE, perimeter security
- Cloud kitchens
Hygiene, prep SLA, safety alerts
- Manufacturing
PPE, safety zones, line monitoring
Product modules
- Video AI
Detection & agentic intelligence
- Cloud VMS
Multi-site video layer
- Agentic AI
Talk to your cameras
- Data & integrations
POS, API, exports
- Alert channels
WhatsApp, Slack, SMS
- Edge & on-prem
Local AI, hybrid sync, residency
Related use cases
- Multi-site oversight
Regional dashboards, benchmarking
- Service quality & SLA
Wait times, station use, handoff discipline
- Safety & compliance
PPE, hygiene, SOP verification
- Loss prevention & shrink
Shrinkage, cashier fraud, incident response
Talk to us — or see it live
Tell us about your sites and goals, and we'll show you exactly what Slinai surfaces on your existing cameras.
Book a live demo
A focused 30-minute session, tailored to your operation.
- Live walkthrough on footage like yours
- Your top use-cases mapped to detections
- Deployment plan for your cameras & sites
- Indicative pricing and ROI estimate
Or reach us directly