Metrics your leadership can actually use
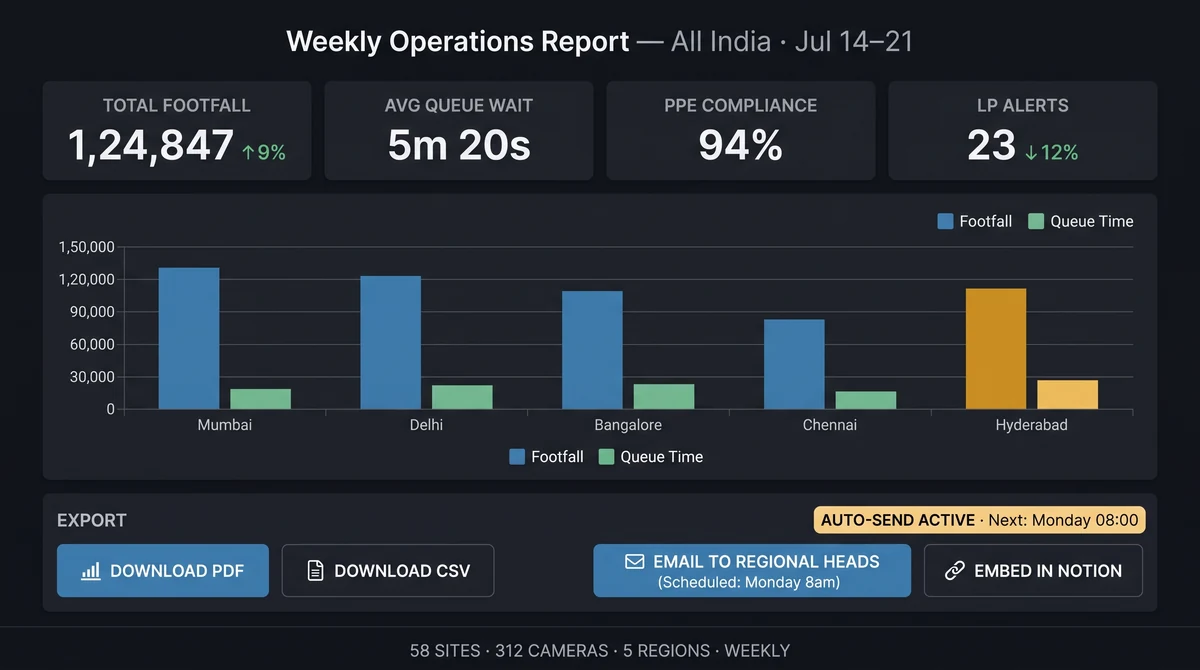
Roll up footfall, queue incidents, safety flags, and LP exception rates for weekly reviews. Export to email, S3, or your BI tool — without rebuilding reports from raw NVR footage.
What can be exported from Slinai?
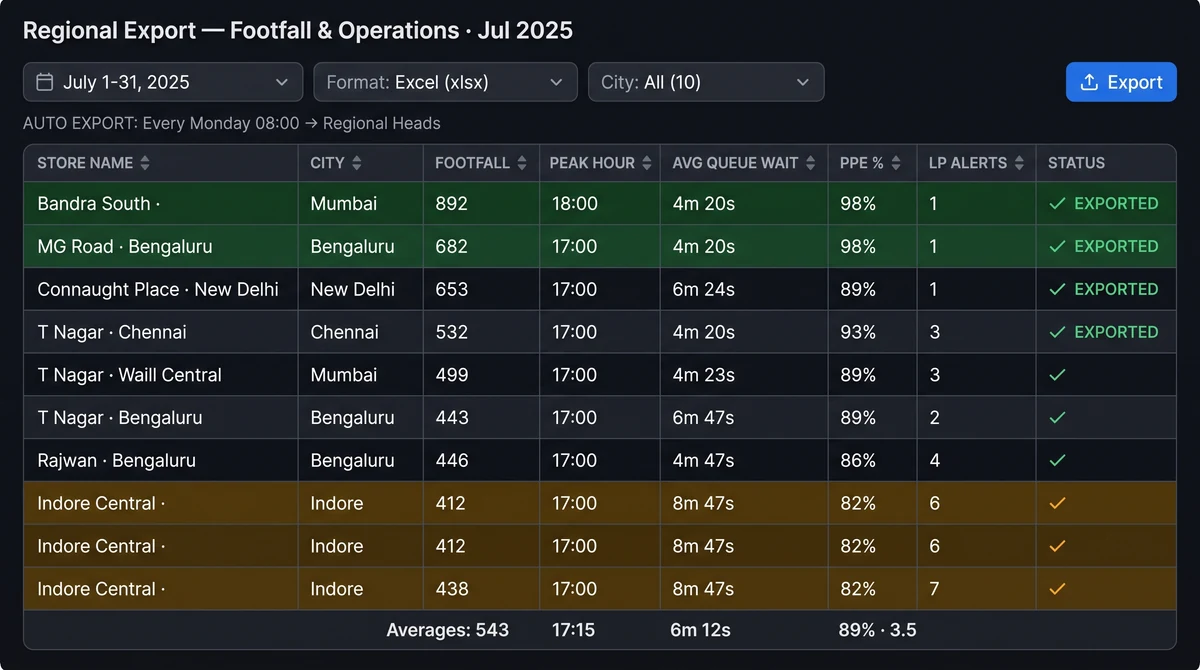
Slinai dashboards cover video-derived KPIs — footfall, dwell, queue wait, alert volumes, camera health, and integrated POS exception rates. Users schedule CSV, PDF, or image exports; embed live views in internal portals; or sync aggregates via API to Power BI and similar tools.
What Dashboards & exports delivers
Regional roll-ups
Compare stores, warehouses, or campuses with normalised KPIs and peer benchmarking in a single view.
Scheduled delivery
Email Monday morning PDFs to regional heads; drop CSVs to secure storage automatically on any schedule.
Permission-aware exports
Recipients only see sites their role allows — exports respect the same scopes as live dashboards.
BI-friendly formats
CSV schemas designed for Excel, Google Sheets, and enterprise BI connectors with consistent column naming.
KPI library
Pre-built footfall, queue, safety, and LP metrics — or compose custom views from raw detection aggregates.
Live embeds & anomaly alerts
Embed dashboard tiles in Confluence or internal portals; trigger threshold alerts when KPIs deviate from targets.
From camera feeds to board-ready numbers
HQ teams across India run weekly ops calls with inconsistent spreadsheets pulled from different sources. Slinai standardises KPIs so every region reports footfall per sq ft, average queue time, and safety incident rates the same way — then exports the pack automatically before Monday's review.
Drill from export summary to live Cloud VMS playback when a number looks wrong; no separate tools for video validation.
Reports that write themselves
Leadership stops asking ops teams for numbers and starts discussing what the numbers mean. Scheduled KPI packs with footfall trends, queue SLA compliance, safety incident counts, and LP exception rates arrive before every ops call.
When POS or workforce integrations are enabled, transaction and staffing metrics appear in the same export alongside video-derived KPIs — one source of truth for the whole operation.
Explore further
Industries served, use case playbooks, and platform modules that connect with Dashboards & exports.
Where teams use this
Outcome playbooks
Works best with
See Dashboards & exports on your cameras
Tell us about your sites and we'll show what Slinai surfaces on the CCTV you already own.
Common questions
Can exports include POS metrics?
When POS integration is enabled, exception rates and correlated case counts appear alongside video KPIs in the same export.
How often can schedules run?
Daily, weekly, or custom cron-style schedules per report template — aligned to your ops cadence.
Do exports contain video files?
Default exports are metrics and metadata. Clip exports are separate, access-controlled actions from playback or the alert interface.
Can dashboards include non-video KPIs?
When POS or workforce integrations are connected, transaction and staffing metrics appear alongside video-derived KPIs in the same tiles and exports.
Is there a way to alert on KPI anomalies?
Yes. Set threshold alerts on any KPI — footfall drop vs last week, queue wait average above target — via Alert channels or webhooks.
Talk to us — or see it live
Tell us about your sites and goals, and we'll show you exactly what Slinai surfaces on your existing cameras.
Book a live demo
A focused 30-minute session, tailored to your operation.
- Live walkthrough on footage like yours
- Your top use-cases mapped to detections
- Deployment plan for your cameras & sites
- Indicative pricing and ROI estimate
Or reach us directly