SLAs you can measure — not debate
Wait-time estimation, queue-length monitoring, and unattended-customer detection on cameras you already own. Operations leads get clip-backed WhatsApp alerts when SLA thresholds slip — across billing counters, service stations, drive-thrus, and branch desks.
Works with any IP camera · Hikvision · CP Plus · Dahua · ONVIF
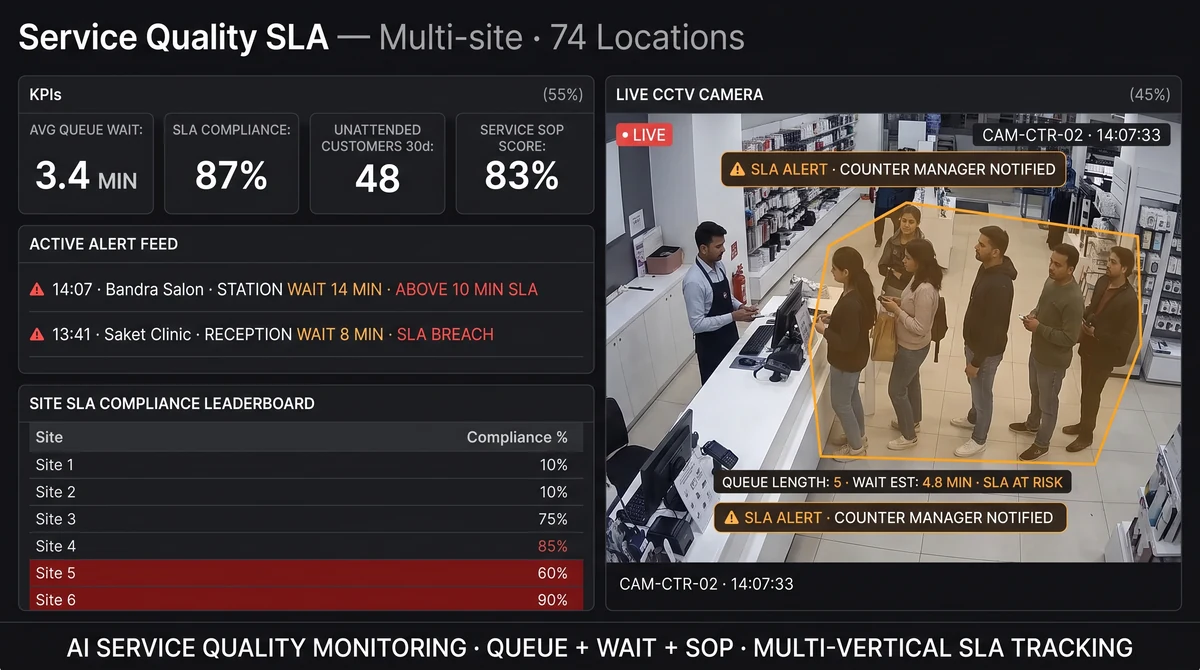
How does Slinai measure service quality SLA?
Slinai draws detection zones on queue lanes, service stations, drive-thru windows, and branch desks using existing IP cameras. Computer vision estimates queue length, wait time, and counter coverage in real time. When thresholds are crossed — queue over SLA, station idle too long, customer unattended — floor supervisors receive a WhatsApp alert with site name, location ID, metric reading, and a clip link. Trends aggregate hourly, daily, and weekly for operations reviews and multi-site benchmarking.
Alert latency depends on site connectivity. Coverage across retail, QSR, salons, clinics, gyms, bank branches, diagnostics, and drive-thru formats.
From manager intuition to verifiable SLA data — on every counter, in every format
Service quality in Indian consumer-facing businesses has historically been measured by the most imprecise instruments available: mystery shopper visits that happen once a quarter, customer satisfaction surveys that capture sentiment after the damage is done, and manager observation that is limited to the hours a senior person happens to be on the floor. The fundamental problem is not that these signals are wrong — it is that they are too slow, too sparse, and too easily contested to drive consistent operational improvement across a 50-branch network. A branch manager who receives a low mystery-shopper score in January does not have the granular data to know whether the problem was Monday mornings, the second billing counter, or a specific shift supervisor whose team consistently underperformed.
Video-based service quality measurement solves this by treating every camera frame as a data point. A detection zone drawn on a queue lane captures every person who enters the queue and every second they spend waiting, 18 hours a day, seven days a week, without observer bias or sampling error. The result is not a survey estimate — it is a measured distribution of wait times across every hour of every day of every week, segmented by counter, by daypart, and by location. Operations managers can identify the precise hour on Wednesday evenings when the Andheri West branch consistently breaches a three-minute SLA, and they can do it using data from last week rather than an audit scheduled for next month.
The economic case for verifiable service quality data rests on two distinct mechanisms. The first is direct service recovery: when an SLA breach fires and a WhatsApp alert reaches the floor supervisor within 30 seconds, the supervisor can address the queue before a customer abandons it. Published research from Indian retail and food-service contexts suggests that queue abandonment — customers who leave without completing a purchase or receiving service — costs organised retailers between 3% and 8% of potential transaction value at affected counters during peak hours. Early alert-driven intervention captures a portion of that value that would otherwise be permanently lost. The second mechanism is structural optimisation: the week-over-week wait-time distribution data identifies chronic SLA breach patterns that alert-driven intervention cannot solve because the root cause is roster depth, counter layout, or technology constraints rather than individual supervisor responsiveness.
Slinai's service quality platform is designed around eight consumer-facing formats that together cover the majority of India's organised service economy: retail supermarkets and apparel stores, QSR outlets and food courts, salons and wellness chains, diagnostic clinics and day-care hospitals, gyms and fitness chains, bank and NBFC branches, pharmacies and drug-store chains, and drive-thru quick service formats. Each format has different SLA norms — a bank branch has a different wait-time target from a QSR counter — and Slinai configures detection zone calibration and alert thresholds per format rather than applying generic defaults. The multi-site benchmarking layer normalises across formats using compliance rate — the share of monitored periods that stayed within target — so a retail chain VP can compare a supermarket queue SLA and a branch service-desk SLA on the same dashboard without the absolute difference in wait-time targets making the comparison meaningless.
Privacy and data minimisation are explicit design constraints for service quality monitoring in Indian contexts. Slinai's queue and station occupancy detection counts anonymous persons in defined zones — no facial recognition, no biometric data capture, no cross-session individual tracking. This design is not solely a technical choice but a deliberate alignment with the DPDP Act's data minimisation principle: the system collects only what is needed to measure service quality, not the underlying identity of the persons whose wait time is being measured. For diagnostic clinics and financial-service branches operating under heightened privacy expectations, anonymous counting enables the operational data they need while maintaining the patient and customer privacy the context requires.
Get instant answers about your service quality SLA
Ask Slinai in plain language — get wait-time trends, SLA compliance rates, station occupancy data, and drill-down clips across every location without pulling a single NVR log.
- Queue SLA
Real-time wait-time monitoring
Detection zones on queue lanes and billing counters estimate wait time continuously. SLA breach alerts reach floor supervisors on WhatsApp in under 30 seconds — before customers abandon the queue.
- Station coverage
Unattended-customer detection
When a customer is present at a service station and no staff member appears within your defined threshold, an alert fires to the nearest supervisor with the station ID and a clip link.
- Multi-site board
SLA compliance benchmarking
Compare wait-time SLA adherence across every branch in your network — normalised to compliance rate so a QSR counter and a bank desk are comparable service-health signals on the same board.
Which branches breached their wait-time SLA most often this week?
Three branches led SLA breaches this week. Connaught Place breached its 4-minute front-desk SLA 31 times across the week, concentrated almost entirely in the 11:30 AM–1:00 PM window on Monday, Tuesday, and Thursday. Koramangala breached 22 times, with breaches spread across both the morning token desk and the afternoon billing counter. Thane West breached 18 times — all during the 6:00–8:00 PM weekday evening rush where only one counter was staffed against a documented two-counter requirement. Do you want me to pull a clip from any of these locations?
Show me what a typical queue breach looks like at Connaught Place.
Here is the billing counter queue at Connaught Place from Tuesday at 12:41 PM — the point where estimated wait crossed the 4-minute SLA. The frame shows nine people in the primary queue lane with both counters staffed but one counter processing a complex transaction. The alert fired at 12:41:18 AM and the floor supervisor acknowledged at 12:43:52 — a 2-minute 34-second response. A third counter opened at 12:46 and the queue cleared below SLA by 12:52. I can clip any specific event from this week if you want to use it in a supervisor coaching session.
Are any service stations currently showing an unattended customer?
Right now, Station 3 at the Bandra West outlet has a customer seated and no staff member present — the timer has been running for 3 minutes 12 seconds against your 4-minute unattended threshold. The floor supervisor's WhatsApp alert will fire in approximately 48 seconds if the station is not attended. Separately, the reception desk at Navi Mumbai has shown no staff presence for 6 minutes during what should be a staffed period — I sent an alert to the location manager at 14:32 PM, which has not yet been acknowledged.
How does our SLA compliance compare across formats this month?
SLA compliance rates this month by format: QSR counter lanes are at 84% — your best-performing format, with strong consistency outside the 1:00–2:30 PM lunch peak. Salon and wellness stations are at 71%, pulled down by three flagship locations with high Saturday occupancy. Clinic front desks are at 68%, with the morning registration rush between 8:30 AM and 10:00 AM the primary breach window across all locations. Bank branch teller counters are at 76%, which is above the format target but with one branch — Powai — consistently in the bottom quartile. I can generate a format-by-format SLA compliance report for the month if you need it for your management review.
What is the average drive-thru cycle time across our pharmacy locations this quarter?
Average drive-thru cycle time across your 11 pharmacy locations this quarter is 3 minutes 41 seconds — within your 4-minute target at the network level. However, two locations are structural outliers: Sector 14 Gurugram averages 5 minutes 18 seconds, which is 38% above target and generating alerts on 4 out of 5 weekday mornings. Kothrud Pune averages 4 minutes 52 seconds. The remaining 9 locations average 3 minutes 21 seconds. The Gurugram gap was already visible in last quarter's data — this is the third consecutive quarter where that location has led the network on cycle time. The dispensing workflow there appears to differ from the network benchmark; I have a comparison clip from the two fastest locations that might help frame a process review.
Every service quality signal, one platform
Slinai's service quality capability set spans the full customer experience lifecycle — from real-time queue alerts to multi-site SLA benchmarking and audit-ready compliance exports.
Queue length & wait-time detection
Monitor billing counters, token desks, and pickup windows. Alerts fire when estimated wait crosses your SLA — before customers abandon the queue.
Station occupancy tracking
Know which counters, bays, and service stations are covered or idle and for how long — actionable data for floor managers and roster planning.
Unattended-customer detection
Detect customers waiting at unmanned stations or desks and notify the nearest staff on WhatsApp before the service gap escalates to a complaint.
Drive-thru cycle timing
Measure car-to-served cycle at QSR and pharmacy drive-thrus from camera timestamps — no dedicated hardware, no manual stopwatch.
Handoff & coverage SOP checks
Verify that service handoffs — counter-to-kitchen, receptionist-to-treatment room — happen within defined time windows and are staffed on both sides.
Multi-branch SLA benchmarking
Compare wait times and station coverage across every location in a city cluster or format group — with one-tap drill-down to live video.
See service quality & sla on your cameras
Book a walkthrough — we'll map detections, alerts, and dashboards to your sites.
How Slinai turns existing cameras into a live SLA dashboard
Five steps from camera stream to verified wait-time data, real-time alerts, and multi-site SLA reporting — without hardware changes.
- 1
Connect your existing cameras
Slinai ingests RTSP/ONVIF streams from Hikvision, CP Plus, Dahua, and mixed-vendor NVRs already installed at counters, desks, service bays, and drive-thru windows — no new hardware, no rewiring required.
- 2
Draw detection zones on your camera feeds
The onboarding team draws queue zones, station occupancy zones, handoff corridors, and drive-thru entry and exit lines on your existing camera views — calibrating to your floor layout, counter configuration, and typical occupancy density.
- 3
Set SLA thresholds per zone and daypart
Configure wait-time SLA targets per counter, per format, and optionally per daypart — different limits for morning rush versus afternoon lull, weekday versus weekend, or festive peak periods. No hardware change required when thresholds evolve.
- 4
Configure alert routing and digest schedules
Floor supervisors, location managers, and area managers receive SLA breach alerts and digest summaries through their preferred channel — WhatsApp group, individual number, or email — configured per zone during onboarding.
- 5
Review, benchmark, and optimise
The multi-site SLA board populates from the first day of go-live. Slinai's onboarding team refines detection accuracy with site-specific feedback over the first two weeks and publishes validated zone configurations as format templates for subsequent site rollouts.
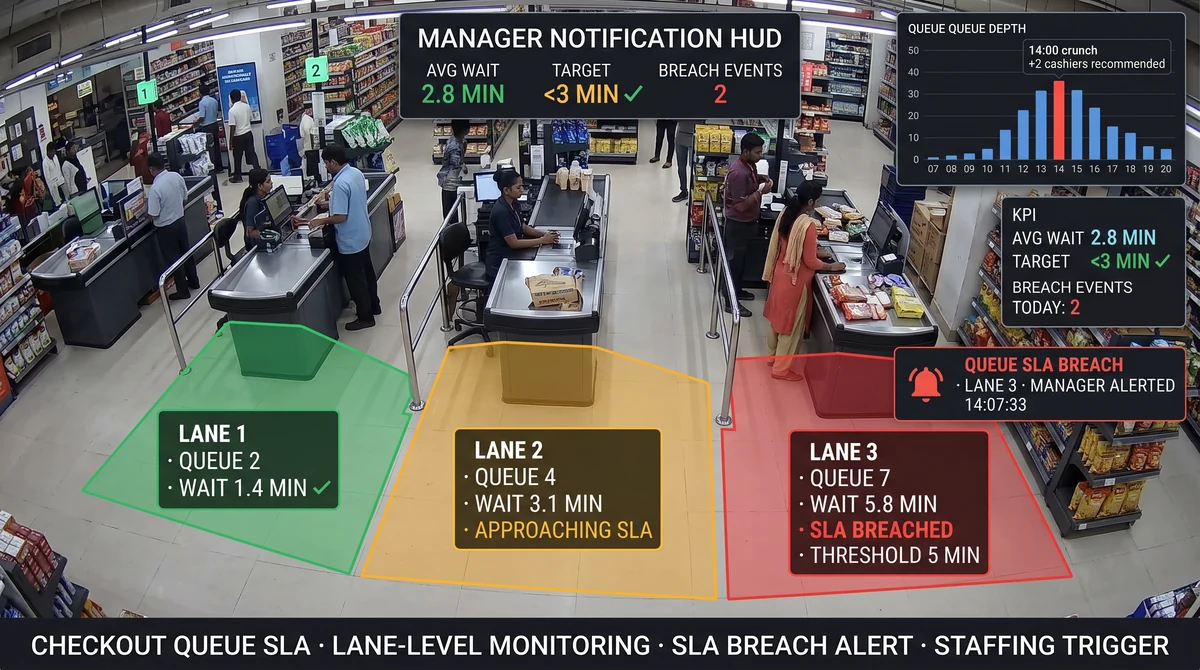
Stop losing baskets at the billing counter
A grocery chain operating twenty-plus stores across three Indian cities tracked customer walkouts through exit surveys — but could not pinpoint which billing lanes triggered most abandonment. After drawing queue polygons on existing CCTV, wait-time data arrived in the operations dashboard within the first week. Counters with chronic three-minute-plus queues were identified by hour and by day, pointing to a staffing pattern where two lanes closed early on weekday evenings just as post-work traffic peaked.
Slinai alerts landed in the floor supervisor's WhatsApp group the moment queue wait crossed two and a half minutes. The team redistributed staff from receiving to billing on affected evenings. Customer-facing checkout time dropped measurably without adding headcount — because the problem was allocation, not capacity.
Queue monitoring now runs across all stores from the same dashboard. HQ sees which branches breach SLA more than twice per shift, which respond within three minutes of an alert, and which need layout changes rather than roster fixes. The data is specific enough that store managers accept it in weekly reviews instead of challenging methodology.
Grocery chain reduces peak-hour queue abandonment by identifying an evening staffing allocation gap
A regional grocery supermarket network operating 22 outlets across Uttar Pradesh was recording a persistent gap between peak-hour footfall counts and transaction volumes — implying that customers were entering but not completing purchases at a rate the operations team could not explain through product availability or pricing. After deploying Slinai queue detection, the analytics revealed that five stores were consistently breaching a 2.5-minute checkout SLA between 6:00 PM and 8:00 PM on weekday evenings — a window where shift plans had two billing counters staffed despite customer volumes that historically required three. Wait times during that window averaged 4 minutes 18 seconds. After adjusting rosters to maintain three billing counters during the evening peak at affected stores, average wait times during the window dropped to 1 minute 52 seconds and the transaction-to-footfall ratio improved materially in the following month's P&L review.
Station turn times that actually run on time
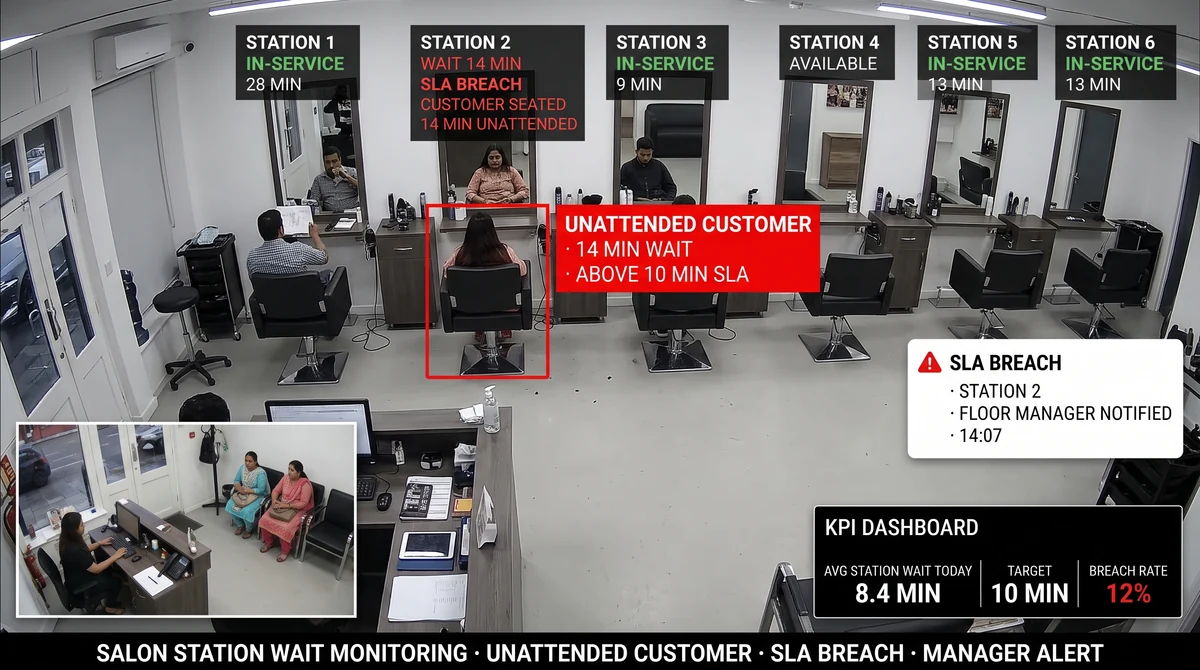
A mid-market salon chain with outlets in seven Indian cities had an NPS problem it could not diagnose from the booking system alone. Appointment slots were filled, but customers were leaving before services started. Exit interviews pointed to post-check-in wait: a customer had arrived on time, been checked in at reception, then sat unattended at a styling station for eight-plus minutes while the stylist finished a previous client elsewhere in the salon.
Slinai station-occupancy detection — using overhead cameras already installed for security — flagged these gaps. The alert rule was set at four minutes: if a customer is seated at a treatment station and no staff member is present within that window, the receptionist's WhatsApp pings. Floor lead response time shortened from 'when the customer complains' to 'before the customer decides to complain'.
Station utilisation data also surfaced a secondary insight: two stations in a corner of the flagship outlet were consistently empty during peak Saturday hours while the rest of the floor was fully occupied. Investigation revealed that ambiguous signage had left customers unaware those chairs were available. The fix was a facilities change, not additional technology spend.
Salon chain reduces post-check-in unattended wait from eight minutes to under three minutes
A premium salon group operating 24 outlets across metro and Tier-2 cities was fielding a steady volume of negative Google reviews citing 'long wait after arrival' — a complaint that the booking system data could not explain because all appointments showed as on-time confirmed. Slinai station occupancy detection revealed a systemic gap: the median interval between a customer sitting at a styling station after check-in and a stylist arriving was 6 minutes 43 seconds at the three outlets generating the most complaints — well above the 4-minute alert threshold. After configuring alerts to the floor lead and adjusting the internal handoff protocol, the median post-check-in wait dropped to 2 minutes 51 seconds across those outlets within six weeks. Negative reviews citing wait time fell by 60% in the following two months.
Book a demo tailored to your salon or wellness chain
We will show you station occupancy detection and unattended-customer alerts running against your outlet layout.
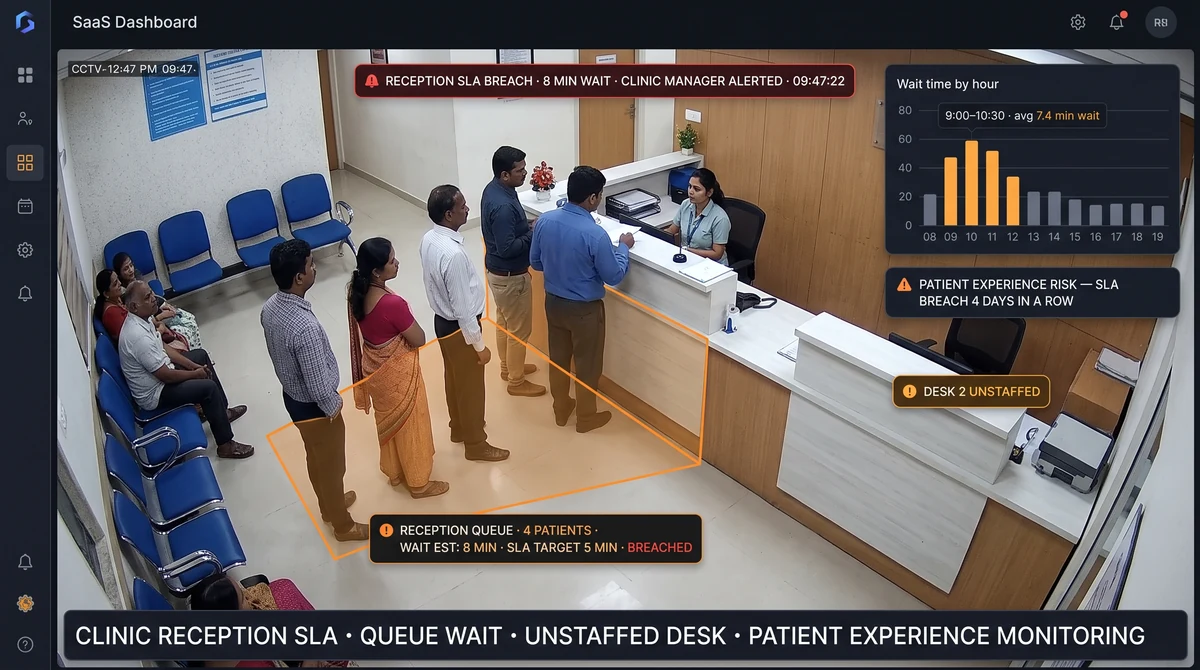
Front-desk wait visibility without patient-data risk
A diagnostic chain operating across tier-1 and tier-2 cities needed queue data at reception but could not instrument individual patient flows under DPDP principles. Slinai's anonymous queue model counted persons in the reception wait zone without storing biometrics or linking individuals across sessions — giving operations leads the wait-distribution data they needed while keeping compliance risk low.
Wait times above ten minutes at the front desk were flagged to branch managers on WhatsApp. Separately, the system measured how long it took staff to move a patient from front desk to the first consultation room — a handoff gap that varied between branches by more than three minutes on average. Branches with consistently slow handoffs received targeted coaching using timestamped clip evidence, making the feedback specific rather than based on impression.
The chain now includes front-desk wait SLA as a branch KPI in monthly performance reviews, with Slinai data as the ground truth. Disputes that previously required reviewing hours of NVR footage are resolved in minutes using the clip search.
Diagnostics chain builds a branch SLA report using anonymous queue data — no patient identifiers involved
A mid-sized diagnostics group operating 18 collection centres across two states needed a defensible metric for front-desk service quality to include in their hospital partnership SLAs. Manual timing by branch managers was inconsistently applied and easily disputed. After deploying Slinai's anonymous queue detection — which counts persons in defined waiting zones without biometric data — the group had a documented distribution of front-desk wait times per branch per daypart. The first monthly report revealed that three branches consistently exceeded a 10-minute wait threshold during the 8:00–10:00 AM morning registration peak. Two of those three were operating with one front-desk staff member during a period that required two. The data gave operations management the evidence to make the staffing case without ambiguity.
Counter speed that holds at every franchise outlet
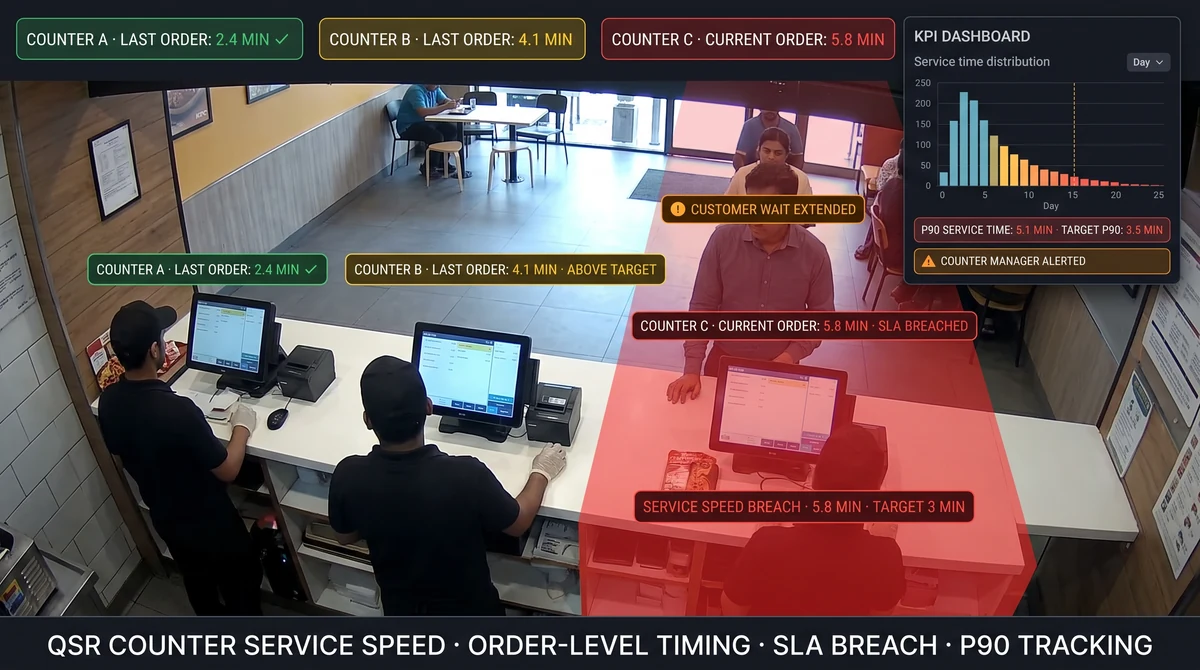
A quick-service restaurant brand operating through a franchise network in India needed consistent counter speed across outlets with varying staff skill levels, kitchen configurations, and peak-hour profiles. Franchise audits happened monthly — but counter speed slipped between visits and the brand had no real-time signal to act on.
Slinai queue zones were calibrated on existing counter-area cameras at each outlet. Counter wait SLA was defined separately for dine-in, takeaway, and aggregator-pickup lanes. Alerts went to both the franchise owner's phone and the brand's regional operations lead whenever any lane exceeded the SLA for more than ninety seconds.
Regional operations leads used the alert log to rank outlets by SLA compliance rate, not audit score alone. Outlets that ranked highly on audit but triggered frequent real-time alerts revealed a different pattern: well-managed during scheduled inspection, under-managed in between. The data changed how the brand thought about franchise performance — and how franchise agreements were structured at renewal.
QSR brand identifies outlets well-managed during audits but underperforming between visits
A QSR franchise group with 78 outlets across South India had been relying on monthly brand audits as the primary quality-enforcement mechanism. Mystery shoppers consistently gave high scores to a cluster of Hyderabad outlets whose real-time alert data, newly available after Slinai deployment, told a different story: those outlets triggered counter-wait SLA breaches on 35% of monitored weekday lunch intervals — a rate that was statistically impossible to reconcile with the 'excellent counter speed' ratings from monthly audit forms. The brand's regional manager confronted the franchise cluster owner with side-by-side alert data and audit scores, leading to a direct acknowledgement that counter staffing was reduced outside audit windows. A performance improvement plan with weekly alert-rate targets replaced the monthly audit cadence as the primary governance mechanism for that cluster.
The two-minute rule for unattended customers
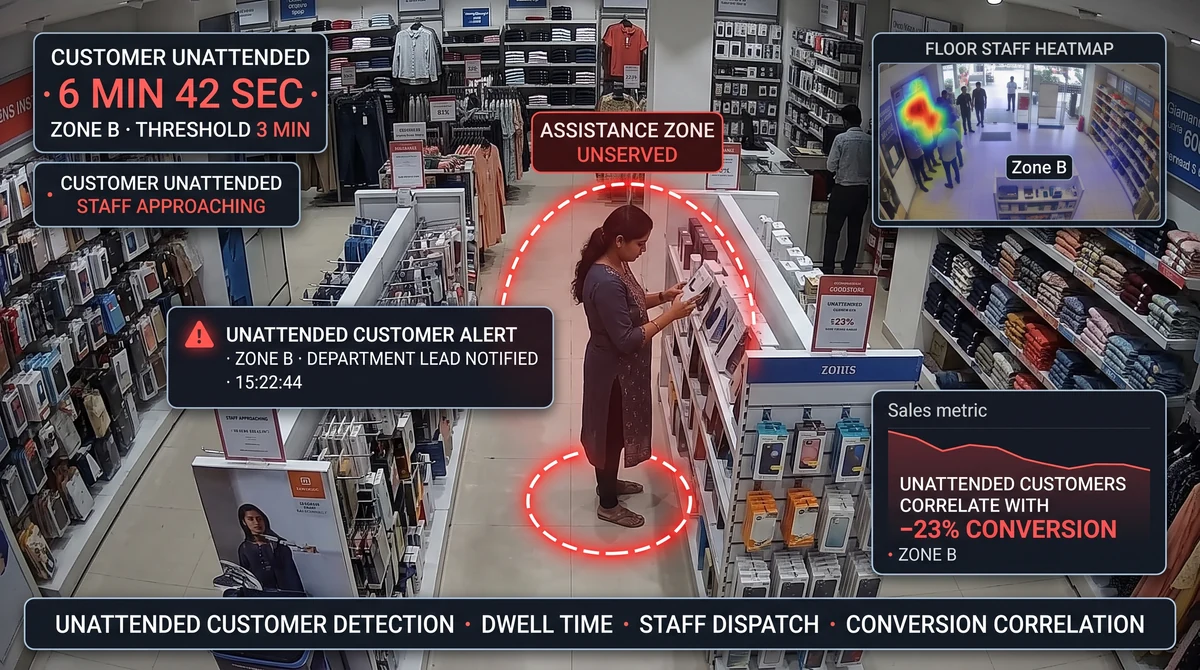
A gym chain managing front desks across more than a dozen city locations had a written standard: no customer waiting at the front desk should go unattended for more than two minutes during staffed hours. The standard existed in the employee handbook but had no enforcement mechanism. Floor managers noticed violations only when customers mentioned them in online reviews — after the damage was done.
Slinai detection zones at each front desk measured the gap between a person entering the waiting area and a staff member appearing within the same frame. When that gap crossed two minutes, a WhatsApp alert went to the location manager with the desk camera ID and a clip link. Resolution required seconds to verify.
Locations that responded fastest to alerts saw improvement in online review scores over the following quarter. Locations that responded slowly identified a different root cause: desks were genuinely understaffed relative to peak check-in windows, not a training issue. The hourly occupancy data gave the operations team the evidence to adjust rosters by location rather than applying a blanket staffing rule across the network.
Gym chain links unattended-desk response time to Google review scores and identifies two staffing gaps
A gym and fitness chain operating 16 locations across Mumbai and Pune had been attributing negative Google reviews mentioning 'no one at the desk' to staff attitude rather than structural coverage gaps. After deploying Slinai front-desk unattended detection across all 16 locations, the operations data showed a 78% correlation between locations with high unattended-alert frequency and locations with below-average Google review scores. Two locations emerged as structural outliers: their alert frequency was three times the network average, and clip review confirmed that front desks were consistently unmanned during the 7:00–9:00 AM and 6:00–8:00 PM peak windows — the precise windows when membership check-in and query traffic peaked. A roster adjustment at those two locations reduced alert frequency by 71% over the following six weeks.
Talk to us about unattended-customer monitoring for your network
We will map detection zones and alert routing to your desk layout and shift structure before you commit.
Service SOPs that hold up between audits
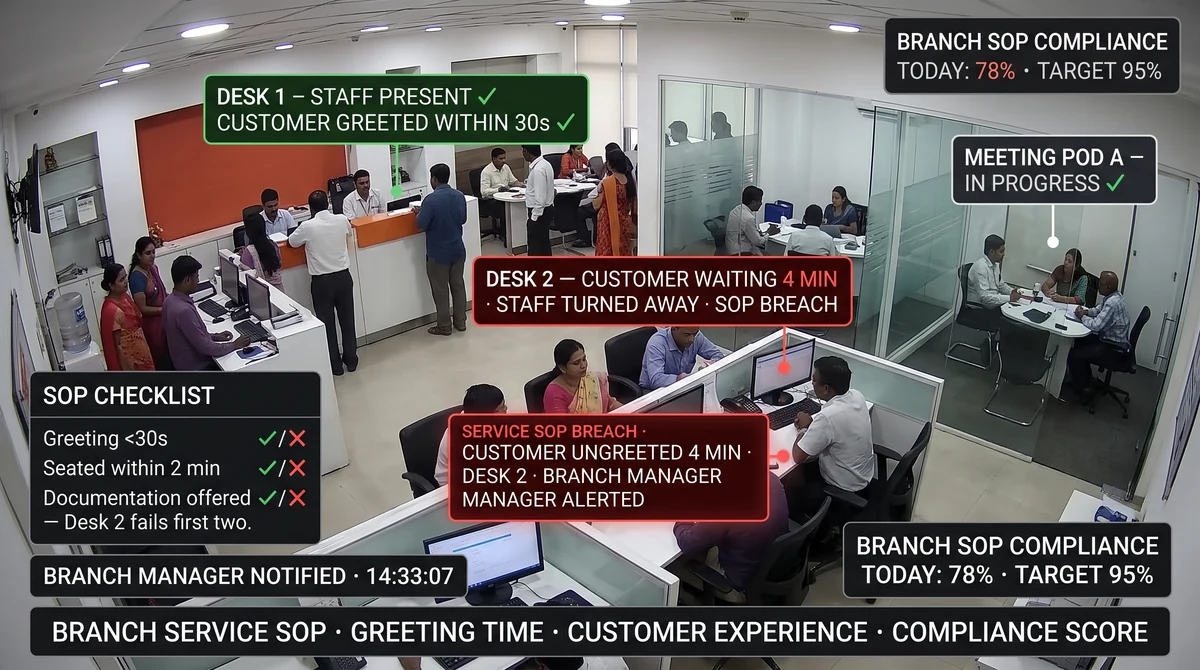
A private-sector bank with retail branches across multiple states had invested in mystery shopping to track counter service standards — but mystery visits could not cover enough branches often enough to catch systemic gaps. Operational standards for teller counters — greet within thirty seconds, complete the transaction within five minutes, hand off to the relationship manager within two minutes of request — were tracked inconsistently and contested in branch reviews.
Slinai queue and zone models measured teller counter wait from the moment a customer stepped up to the counter to the moment the transaction zone cleared. Branches where counter wait exceeded the SLA threshold more than three times per shift received an alert summary to the branch manager at the end of the day — a digest format rather than a stream of individual pings, matching how branch managers prefer to be informed.
The central operations team received a weekly SLA adherence report across all branches, ranked by compliance rate. Branches in the bottom quartile for two consecutive months were prioritised for field coaching. Clip evidence made coaching specific — 'here is the interaction, here is the moment the handoff was missed' — rather than a policy reminder that staff could abstract away.
Private bank replaces contested mystery-shopper counter scores with camera-evidenced SLA compliance data
A regional private-sector bank operating 43 branches across three states had been running quarterly mystery-shopping programmes to assess teller counter service quality — a programme whose results were consistently disputed by branch managers who argued that scores reflected a single visit by an evaluator and not representative branch performance. After deploying Slinai teller counter wait monitoring, the central operations team had a continuous data stream covering every service interaction across all 43 branches. The first full quarter of data revealed that 9 branches were consistently in SLA breach for more than 15% of their monitored intervals — a finding the mystery-shopper scores had not surfaced for 7 of those 9 branches. The regional head used the clip-backed SLA data to initiate coaching at underperforming branches, with the branch management team accepting the evidence without the disputes that had characterised previous mystery-shopper review meetings.
Cycle times without stopwatches or separate hardware
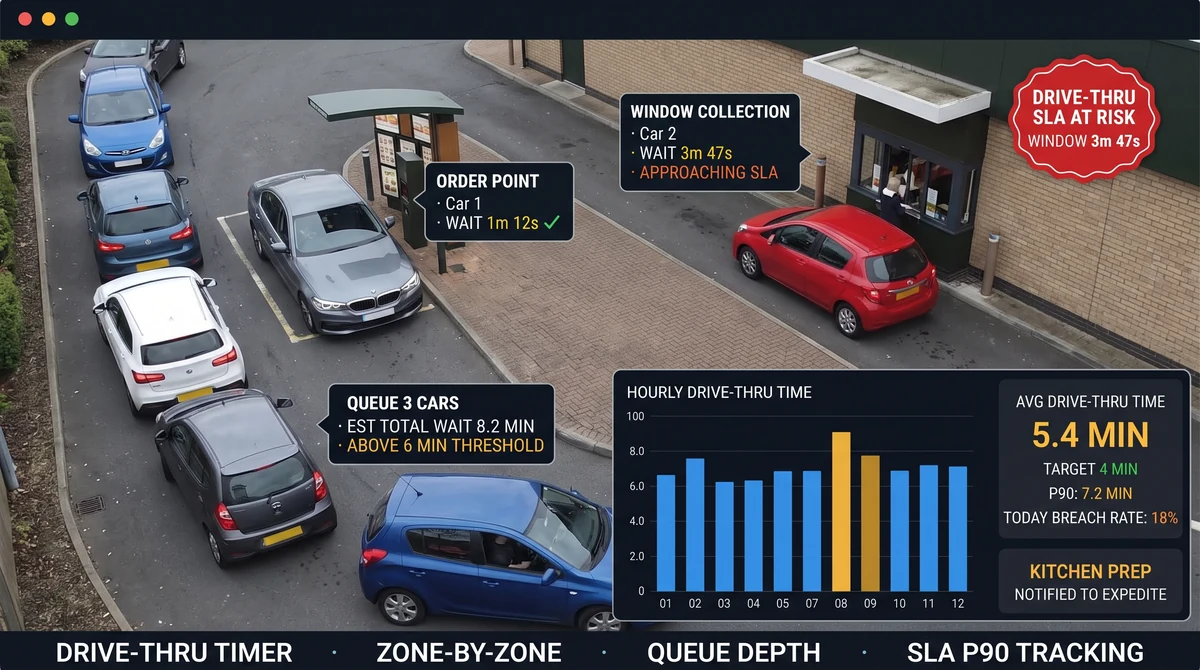
A pharmacy chain rolling out drive-thru dispensing windows needed to measure vehicle cycle time — the interval between a car stopping at the service window and the car moving off after collection. Point-of-sale timestamps were incomplete because staff sometimes processed the transaction before the patient arrived at the window. Manual timing by supervisors was impractical across thirteen locations operating different peak patterns.
Slinai drew a vehicle detection zone at each drive-thru window using the existing external security camera. A secondary zone at the waiting bay measured queue build-up when more than two cars were present. Cycle time per vehicle was logged automatically; when the rolling five-vehicle average crossed four minutes, the store manager received a WhatsApp alert.
The chain discovered that cycle time varied by two full minutes between locations processing similar daily volumes — pointing to dispensing workflow differences, not queue length. Two locations with consistently fast cycle times were used as benchmarks in a process-improvement workshop. The measurement baseline made the operational case for change in a way that anecdotal manager reports and quarterly audits had not.
Pharmacy chain discovers a two-minute cycle-time gap between top and bottom locations — and closes it
A pharmacy chain running drive-thru dispensing across 13 locations in NCR and Bengaluru had no measurement baseline for vehicle cycle time — the metric that most directly determined customer experience at the window. After deploying Slinai vehicle detection at all 13 windows, the first month of data revealed that cycle time ranged from 2 minutes 41 seconds to 5 minutes 9 seconds across the network, with no relationship to volume — some slow locations were processing fewer vehicles per hour than fast ones. The two fastest locations were identified as benchmarks and their dispensing counter layout and workflow was documented in a standard operating procedure shared with the four slowest locations. Three months after the workflow changes, the slowest four locations had reduced average cycle time by 1 minute 22 seconds, bringing the full-network range down to 2 minutes 41 seconds to 3 minutes 48 seconds.
Book a demo for your drive-thru or pharmacy format
We will show you vehicle detection, cycle timing, and SLA breach alerts running on your existing external cameras.
One SLA board for every format, every city
Operations heads managing fifty-plus service locations across India face a fundamental challenge: every branch format has different SLA norms, different peak hours, and different root causes when service slips. A single report template either obscures format differences or requires excessive manual curation to remain useful.
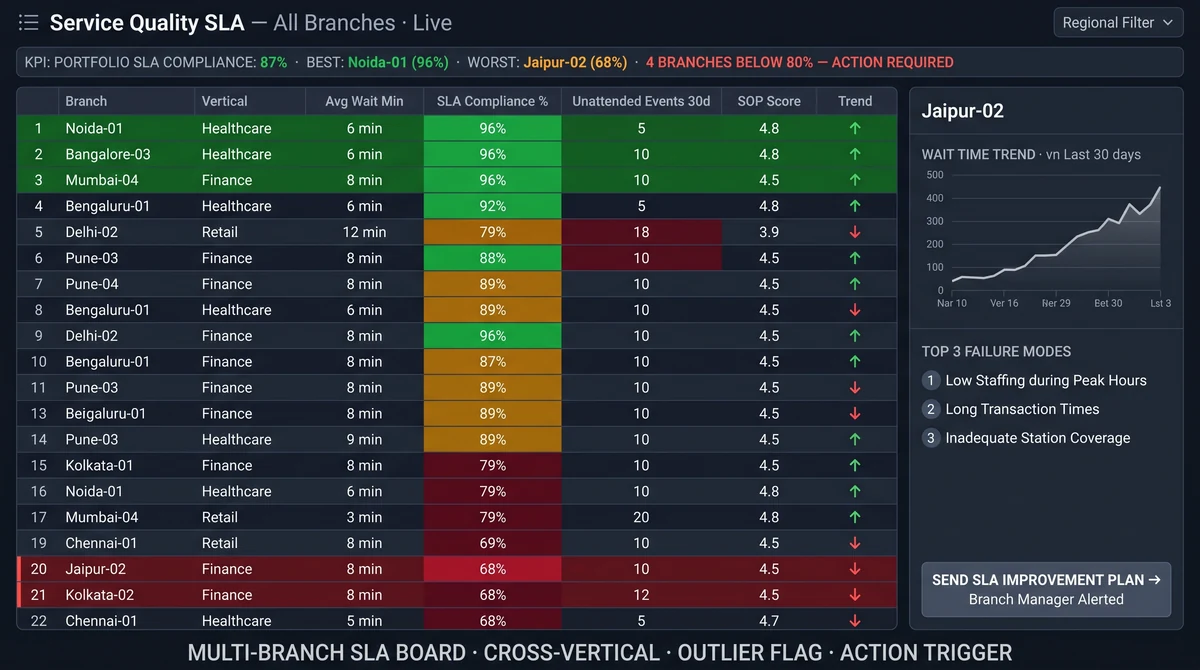
Slinai's multi-site SLA board surfaces per-format compliance rates side by side — QSR lunch queues, clinic morning-rush wait times, salon weekend station occupancy, bank month-end teller demand — with drill-down to the individual branch and to the hour. Each location's SLA thresholds are configured to its format; the dashboard normalises performance to compliance rate so a QSR counter and a clinic front desk are comparable as service-health signals even though their absolute wait-time targets differ.
Regional managers use the board in Monday morning reviews: which locations are consistently green, which are trending amber, and which triggered enough alerts last week to warrant a site visit. Drill-down to live or recent video is one tap from a compliance tile — no separate NVR login, no chasing branch managers for footage. Investigations that previously consumed a full working day resolve before the review meeting ends.
Consumer services group replaces manual weekly branch reports with a live multi-format SLA board
A diversified consumer services company operating salons, gyms, and diagnostics centres across 56 locations in seven cities was running three separate weekly report processes — one per business format — that each required branch managers to self-report queue and wait metrics that no one could validate. The COO described the situation as 'knowing we had SLA problems but not knowing where or how severe, because the data we received was shaped by what each branch manager chose to share.' After deploying Slinai across all 56 locations and configuring the multi-site SLA board with per-format thresholds, the weekly report chain was replaced by a live dashboard that the COO and three regional managers reviewed in a single 15-minute Monday session. In the first quarter, the board identified 11 locations where measured SLA compliance was materially below what self-reported data had suggested — locations that had not been prioritised for operational intervention because their own managers had not escalated the data.
Service quality SLA monitoring across every Indian consumer format
Slinai's service quality capability set is calibrated for the wait-time and station-coverage dynamics of each format — not applied generically across all contexts.
Retail supermarkets & apparel stores
- Queue detection on billing lanes with wait-time SLA alerts to floor supervisors within 30 seconds of threshold breach
- Lane-by-lane SLA compliance rates by hour, daypart, and day of week to identify chronic understaffing windows
- Multi-store SLA board showing which outlets breach most often and at what time — drill-down to billing camera in one tap
- Integration-ready to flag when queue SLA breaches correlate with high-footfall periods in the footfall analytics module
- Opening-counter compliance monitoring — detect when fewer counters than required are staffed during peak hours
QSR & food courts
- Per-lane SLA thresholds configured separately for dine-in, takeaway, and aggregator-pickup queues
- Counter wait SLA breach alerts to franchise owner and brand regional lead simultaneously for accountability
- Drive-thru cycle timing on existing external cameras — no dedicated ANPR or loop hardware required
- Franchise outlet SLA compliance ranking to identify outlets performing well on audits but poorly in real time
- Lunch and dinner peak SLA trend analysis to guide roster and counter-staffing decisions by outlet and daypart
Salons & wellness chains
- Station occupancy detection to measure post-check-in unattended gap at treatment and styling stations
- Configurable unattended-customer alert threshold per station type — styling chairs vs. treatment rooms vs. waiting area
- Stylist arrival timestamp logging for shift performance review using clip-backed evidence rather than manager observation
- Saturday peak utilisation dashboard showing which stations are idle during full-floor days — layout optimisation signal
- Multi-outlet SLA board comparing unattended-customer event frequency across city and format clusters
Clinics, diagnostics & hospitals
- Anonymous person counting in reception and consultation waiting zones — no facial recognition or biometric capture
- Front-desk-to-consultation handoff timer to measure the gap between registration complete and first room entry
- DPDP-aligned design: purpose-limited zones, configurable retention periods, role-scoped access to footage
- Morning registration rush SLA monitoring with daypart-specific thresholds for high-demand peak windows
- Branch SLA compliance reports for hospital partnership SLA audits — documented ground truth without manual timing
Bank branches & financial services
- Teller counter wait measurement from customer arrival at counter to transaction zone clearing — continuous, not sampled
- End-of-day SLA digest to branch manager rather than real-time pings — format matches how branch managers operate
- Weekly compliance ranking across all branches for central operations review and coaching prioritisation
- DPDP-aligned audit logging of all footage access events for data governance and RBI-adjacent compliance requirements
- India-region hosting available for operators with explicit data residency obligations under RBI IT framework guidance
Gyms, pharmacies & consumer services
- Front-desk unattended monitoring with two-minute alert threshold configurable per location and staffed-hours schedule
- Drive-thru cycle time measurement at pharmacy dispensing windows using existing external security cameras
- Online review correlation: map unattended-alert frequency by location against Google review rating trends
- Multi-location compliance board showing staffing gap locations versus training gap locations from the same data
- Alert acknowledgement tracking — see which location managers respond to SLA alerts fastest and slowest for coaching
Call us now — or book a live walkthrough
Share your camera count and sites. We'll show detections on sample footage from your industry.
Service quality measurement: manual vs. Slinai
What changes when service quality SLA data comes from continuous camera-based measurement rather than surveys, mystery visits, and manager observation.
| Capability | Without Slinai | With Slinai |
|---|---|---|
| Wait-time measurement | Exit surveys and mystery-shopper timing visits — sparse samples, observation bias, results available weeks after the service window closes | Continuous AI-based wait-time estimation in every monitored zone — accurate per-hour distribution data available in the live dashboard and in weekly trend reports |
| SLA breach response | Breaches discovered after the fact in customer complaints, negative reviews, or post-shift manager walk-throughs — service recovery impossible once the customer has left | WhatsApp alert to floor supervisor within 30 seconds of verified SLA threshold breach — response before the customer abandons or complains |
| Station coverage visibility | Manager observation during floor walks — limited to moments when a senior person is present; unattended gaps during peak hours go undetected until a complaint surfaces | Continuous station occupancy detection with configurable unattended-customer timer — alert fires to supervisor before the threshold is crossed, not after the customer has already left |
| Multi-branch benchmarking | Self-reported branch SLA data compiled manually into a weekly report — susceptible to selective omission and methodological inconsistency across branches | Normalised SLA compliance rate per branch, per format, and per daypart — apples-to-apples comparison across 50+ locations in a single dashboard updated hourly |
| Coaching evidence | Policy reminders and verbal manager feedback based on general impression — easily dismissed as subjective or unrepresentative of typical branch performance | Timestamped clip evidence showing the specific interaction and the moment the SLA was missed — specific, verifiable, and actionable in a coaching conversation |
| Franchise compliance | Monthly audit scores that franchise owners know are coming — behaviour optimised for the audit window, not for ongoing customer experience between visits | Continuous SLA compliance rate across all franchise outlets — real-time alerts expose performance gaps between audit visits and provide evidence that audit scores cannot explain |
| Drive-thru cycle timing | Manual supervisor timing during spot checks or incomplete POS timestamps — impractical across multiple locations, susceptible to sampling bias | Automatic vehicle cycle time measurement from existing external cameras — per-vehicle log, rolling average alerts, and location comparison across the full drive-thru estate |
| Privacy and compliance | Individual customer observation, satisfaction surveys with personally identifiable responses, and point-of-sale data tied to loyalty programme IDs | Anonymous zone-level counting and timing — no biometric data, no individual tracking, DPDP-aligned purpose limitation with configurable retention and role-scoped access |
| New location onboarding | Manual mystery-shopper scheduling, survey programme extension, and manager coaching travel — each new location adds to the operational overhead of the quality programme | Zone calibration templates from existing format deployments — new locations go live in 5–10 days using pre-validated detection configurations with no hardware change |
Video-based service quality SLA monitoring for India's consumer-facing businesses
India's consumer service sector — organised retail, QSR, wellness, diagnostics, financial services, and hospitality — is growing at a pace that makes manual service quality measurement structurally inadequate. A chain that opens 80 new locations in a year cannot sustain a mystery-shopping programme that covers each location with adequate frequency, cannot maintain a consistent surveying methodology across formats and geographies, and cannot recover service quality in real time through post-event reporting cycles. Video-based service quality measurement is not a technology upgrade for India's consumer sector — it is the only method that scales linearly with the growth of the network without proportionally growing the measurement workforce. Slinai's approach to this — drawing detection zones on existing cameras, alerting on WhatsApp, and benchmarking on compliance rate — is purpose-designed for the operational context of an Indian multi-site operator in 2025 and beyond.
The Retail and Consumer industries in India represent a combined addressable market for service quality analytics of extraordinary size: the organised retail sector alone is expected to reach ₹25 lakh crore by 2030, with QSR and food-service chains adding an estimated 50,000–70,000 new outlets across the decade. Each of these outlets has a billing counter, a service station, or a wait-area that is already being recorded by a CCTV camera installed for security purposes. The marginal cost of converting that passive recording into active service quality measurement — using existing camera infrastructure, without new hardware procurement — is low relative to the potential revenue recovery from even a modest reduction in queue abandonment and service failure rates. Slinai's camera-agnostic deployment model is specifically designed to capture this opportunity: any RTSP or ONVIF stream from any manufacturer, in any city, on any broadband uplink, feeds the same SLA dashboard.
WhatsApp is the operational nervous system of India's field service teams — the channel where floor supervisors receive shift instructions, area managers coordinate with their stores, and regional heads track operational status. Slinai's service quality alert model is WhatsApp-native by design: SLA breach alerts reach the right person in the right WhatsApp group within 30 seconds, in the language they work in, with a clip link they can verify without logging into a separate platform. This design choice is not cosmetic. An alert that arrives in a web dashboard notification panel that the floor supervisor never checks is not an alert — it is a data point that improves a weekly report and does nothing to recover the service failure that is happening right now. Slinai's service quality platform is measured by how fast a floor supervisor responds, not by how rich a dashboard a VP can produce in a quarterly review.
Ready to make your service SLAs verifiable?
Slinai connects to your existing cameras in days — not months. Our onboarding team will calibrate detection zones, configure SLA thresholds per format, and show you a live wait-time dashboard before you commit.
Anonymous measurement, purpose-limited data — DPDP by design
Service quality monitoring requires measuring how long customers wait and whether staff are present at service stations — information that is fundamentally about occupancy and time, not about identity. Slinai's detection models are designed around this constraint: queue zones count persons and measure dwell duration without capturing, storing, or transmitting biometric data or individual identifiers. No facial recognition is used in service quality measurement. No cross-session individual tracking links one visit to another. The system knows that seven people were in the billing queue at 2:41 PM on Tuesday and the average wait was 3 minutes 22 seconds. It does not know who those seven people were. This design choice is both a DPDP alignment mechanism — supporting the data minimisation and purpose limitation principles of the Act — and an operational design choice that keeps the platform useful for contexts like diagnostics, financial services, and healthcare where biometric data capture would be legally and ethically unacceptable.
Employee monitoring in service quality contexts is subject to the same proportionality considerations as any workplace monitoring programme under DPDP. Slinai's station occupancy and unattended-customer detection measures whether a staff member is present in a defined zone — not their identity, not their specific activities, not their movements outside the service zone. Alert routing and clip access are role-scoped so that floor supervisors, location managers, and area managers see the data relevant to their span of responsibility, with access logs recording every footage view and clip export. Slinai recommends that operators include camera monitoring disclosure in employment agreements and post visible notices at monitored stations, and provides documentation templates to support operators setting up DPDP-compliant disclosure frameworks during onboarding.
Retention policies in Slinai are configurable per location and per zone, allowing operators to set different archive durations for alert-flagged clips versus background footage, and to align retention with operational investigation cycles rather than defaulting to maximum storage. For consumer-facing businesses in healthcare and financial services, Slinai supports configurations where service quality zone footage retains only long enough to resolve a current-period complaint or SLA dispute — typically 7–30 days — while alert clips tied to active cases retain until the case is closed. India-region hosting is available for operators who require all video data and metadata to remain within India's borders under the DPDP cross-border transfer framework.
Questions teams ask about service quality & sla
Does Slinai require new cameras to monitor wait times and queues?
No. Slinai ingests existing IP camera streams via RTSP/ONVIF. Camera angle, mounting height, and image quality affect detection accuracy — these are assessed during the site survey before go-live. Most standard counter-area and reception cameras are suitable without any hardware change.
How does wait-time estimation work?
Slinai measures the duration a person spends in a defined queue or waiting zone. Estimated wait at the head of a queue combines zone dwell time with learned service-rate patterns per counter. Calibration typically takes one to two weeks of baseline operation and is refined with periodic accuracy checks.
Is customer identity tracked in queue or wait-time monitoring?
No. Queue detection counts anonymous persons in defined zones — no facial recognition, biometric data, or cross-session individual tracking is used. This design supports compliance with DPDP principles of purpose limitation and data minimisation.
Can alerts for different counters or stations route to different staff?
Yes. Alert routing is configured per zone during onboarding. Counter 1 alerts can go to supervisor A's WhatsApp, drive-thru alerts to the shift lead, and front-desk alerts to the location manager. WhatsApp groups, individual numbers, and email are all supported routing targets.
How are SLA thresholds set, and can they change over time?
Thresholds are configured during onboarding per zone, per format, and optionally per daypart — different wait-time limits for morning versus evening shift, weekday versus weekend, or festive peak periods. You can adjust thresholds as your operations benchmarks improve, without any hardware change.
Can I benchmark wait times across formats with different SLA standards?
Yes. The multi-site dashboard normalises raw wait data to SLA compliance rate — the share of monitored periods or transactions that stayed within target. This makes a QSR counter and a bank teller desk comparable as service-health scores even though their absolute SLA thresholds are different.
How fast are SLA breach alerts delivered to WhatsApp?
Typically under thirty seconds from a verified threshold breach to WhatsApp delivery. Delivery time depends on site connectivity and the routing configuration. Batch digest summaries (for formats that prefer end-of-shift reporting over real-time pings) are also available.
Does Slinai support drive-thru cycle-time measurement?
Yes. Vehicle detection zones at drive-thru entry, service window, and exit lines measure car-to-served cycle time from existing external cameras. No dedicated ANPR or loop-sensor hardware is required for cycle-time measurement; accurate vehicle detection requires a clear overhead or near-overhead camera view of the lane.
Keep exploring
Industries
- Consumer services
Walk-ins, wait times, branch security
- Restaurants & QSR
Kitchen hygiene, queues, POS oversight
- Retail video analytics
Footfall, conversion, loss prevention
- Education campuses
Campus safety, attendance, exam integrity
Product modules
- Queues & wait times
Video AI detection pack
- Video AI
Detection & agentic intelligence
- Alert channels
WhatsApp, Slack, SMS
- Data & integrations
POS, API, exports
- Agentic AI
Talk to your cameras
Related use cases
- Operations & productivity
Throughput, staffing, multi-site KPIs
- Multi-site oversight
Regional dashboards, benchmarking
- Safety & compliance
PPE, hygiene, SOP verification
Talk to us — or see it live
Tell us about your sites and goals, and we'll show you exactly what Slinai surfaces on your existing cameras.
Book a live demo
A focused 30-minute session, tailored to your operation.
- Live walkthrough on footage like yours
- Your top use-cases mapped to detections
- Deployment plan for your cameras & sites
- Indicative pricing and ROI estimate
Or reach us directly