Every location on one command screen
Roll up footfall, queue alerts, safety flags, and camera health across regions. Drill from country → city → site → zone without switching tools.
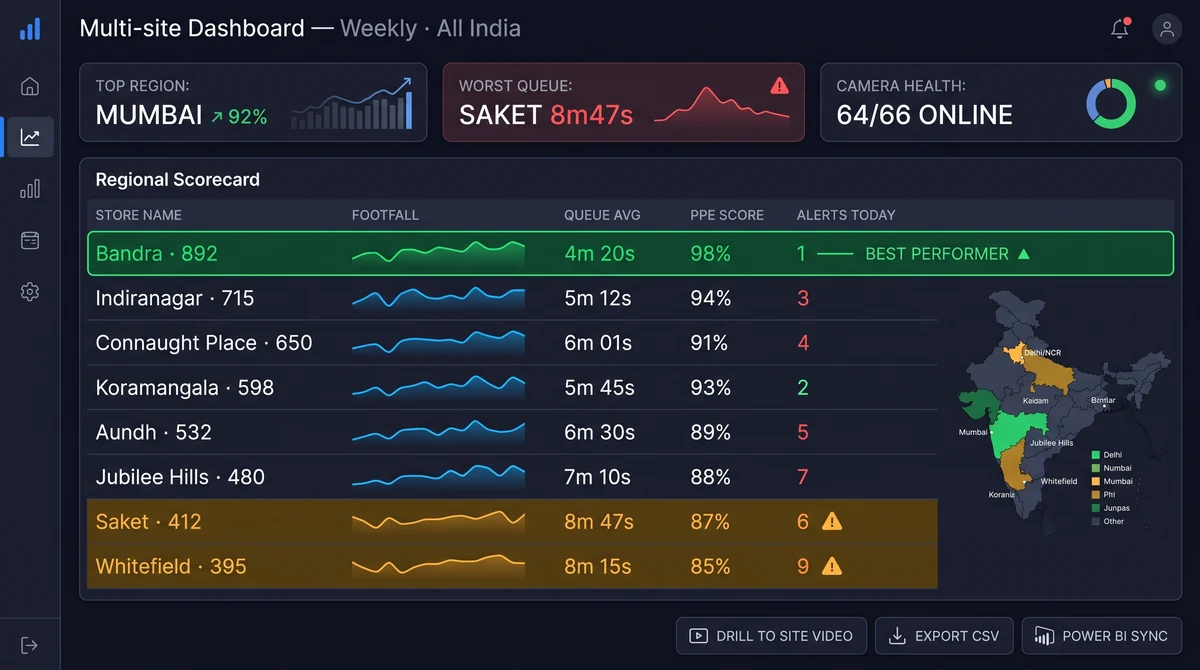
What does the multi-site dashboard show?
The multi-site dashboard aggregates live camera status, AI event counts, and operational KPIs across all locations. Regional managers benchmark stores, warehouses, or branches; HQ spots outliers instantly and opens the underlying video with one click.
What Multi-site dashboard delivers
Regional scorecards
Compare conversion proxies, queue incidents, safety flags, and SLA breaches across store peers in a single view.
Site health tiles
See offline cameras, storage warnings, and integration errors before they become operational blind spots.
Alert volume by site
Understand which locations generate the most actionable events — and which are noisy and need tuning.
Delegated admin scopes
Area managers see only their sites; central teams retain full override and audit visibility.
Outlier detection
Surface the bottom-10% performers on any KPI — footfall, queue wait, PPE rate — for targeted intervention.
Event summary tiles
Today's top alert types — queue, intrusion, compliance — per region without clicking into video.
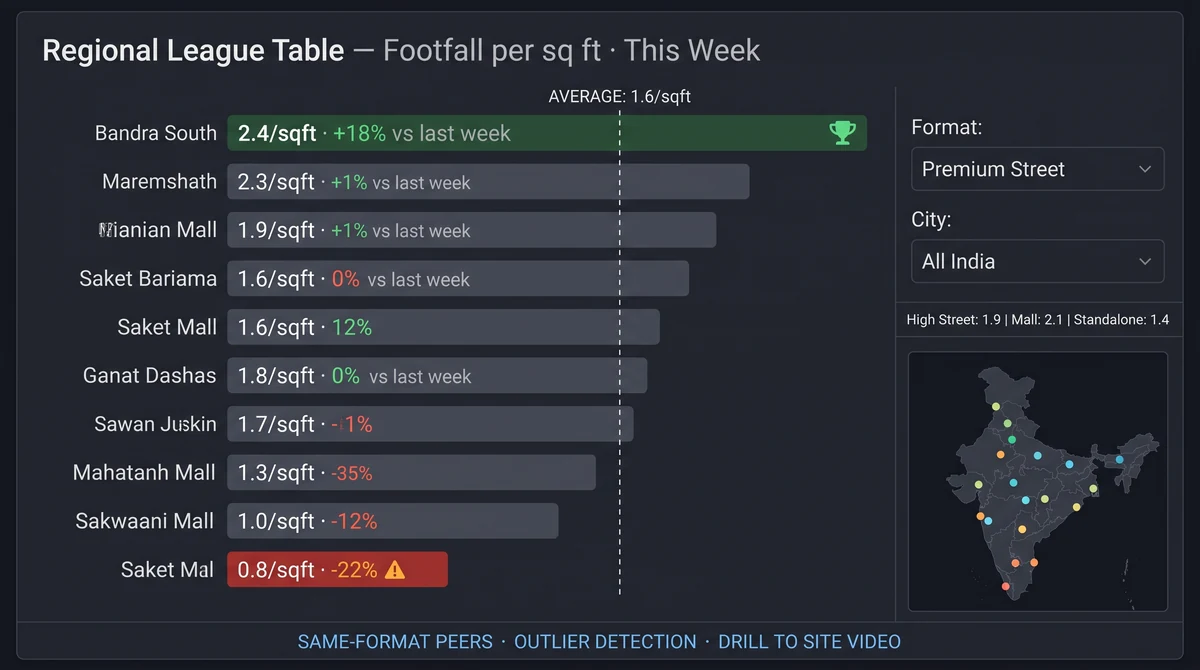
Turn camera data into regional league tables
Multi-site operators win when top-performing locations teach the rest. Slinai normalises KPIs — footfall per sq ft, average queue wait, pick-rate per picker, PPE compliance score — so leaders compare apples to apples across formats and cities.
Link to retail, dark-store, or manufacturing industry packs for pre-built detection bundles per format. League tables update live — no waiting for weekly spreadsheets.
Camera inventory and health you can trust
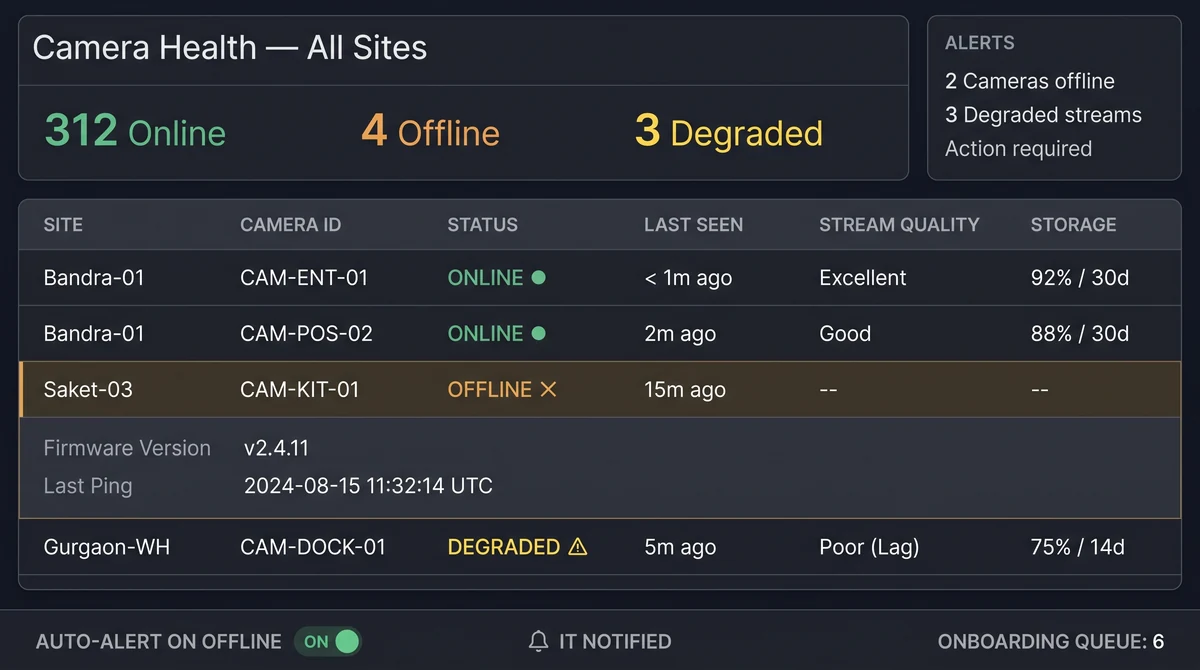
Know which cameras are online, which firmware streams are degraded, and which sites still need onboarding. Operations teams fix blind spots before incidents expose them — not after an audit or LP event.
Camera health integrates with Cloud VMS alerts so IT receives offline-camera notifications before regional managers start complaining about missing footage.
Explore further
Industries served, use case playbooks, and platform modules that connect with Multi-site dashboard.
Where teams use this
Outcome playbooks
Works best with
See Multi-site dashboard on your cameras
Tell us about your sites and we'll show what Slinai surfaces on the CCTV you already own.
Common questions
Can I limit a user to specific regions?
Yes. Role-based access supports region, site, and camera-group scopes with full audit logging of every access event.
Does the dashboard include non-video KPIs?
When POS or workforce integrations are connected, transaction and throughput metrics appear alongside video-derived KPIs in the same tiles.
Can exports from the dashboard feed our BI tool?
Yes. Use the API or scheduled CSV exports via Data & integrations to push dashboard KPIs to Power BI, Looker, or custom analytics stacks.
Is there a mobile-optimised view?
Yes. The browser-based responsive layout works on tablets and phones — area managers access site health from field visits without a desktop.
Talk to us — or see it live
Tell us about your sites and goals, and we'll show you exactly what Slinai surfaces on your existing cameras.
Book a live demo
A focused 30-minute session, tailored to your operation.
- Live walkthrough on footage like yours
- Your top use-cases mapped to detections
- Deployment plan for your cameras & sites
- Indicative pricing and ROI estimate
Or reach us directly