Know who walked in and where they went
Entry-line counting, zone heatmaps, and dwell analytics turn CCTV into footfall and pathing data. Compare malls, high-street stores, and franchise formats — then layer POS when integrated for conversion insight.
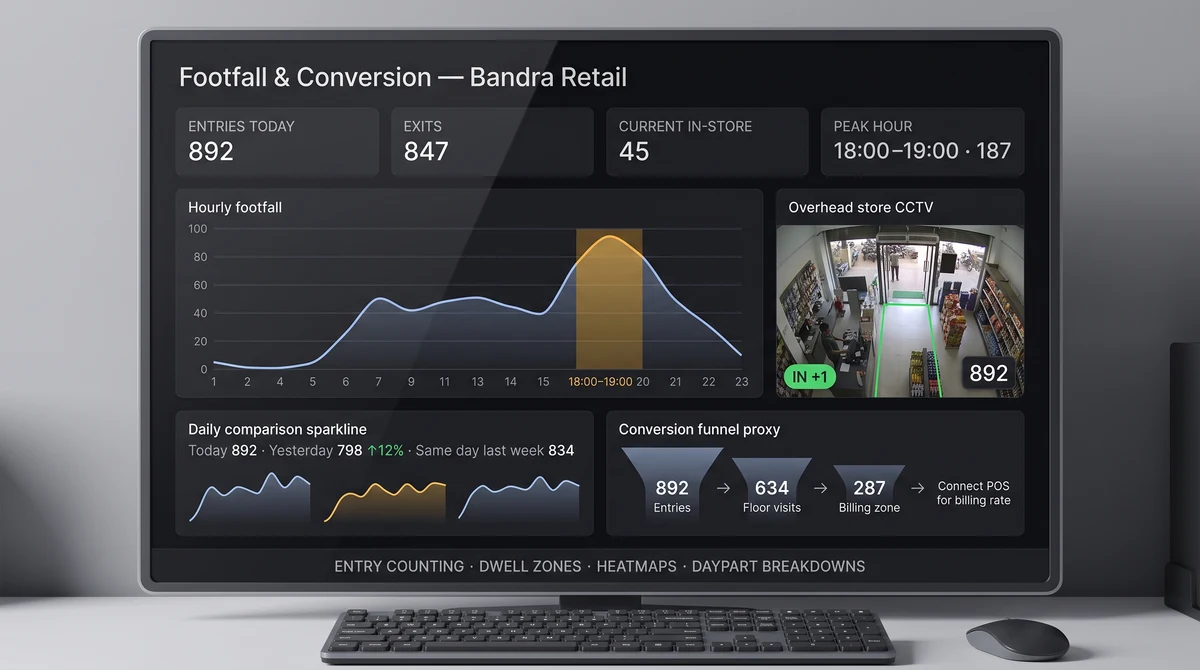
How does Slinai measure footfall?
Slinai draws virtual counting lines at entrances and zones on existing camera views. Models count ins and outs, aggregate hourly and daily totals, and produce heatmaps of movement and dwell. When POS is connected, teams compare traffic to transactions for conversion proxies by store, daypart, or campaign.
What Footfall & conversion analytics delivers
Entry & exit counting
Bidirectional lines at main doors, mall entrances, and event gates — deduplicated across overlapping views where configured.
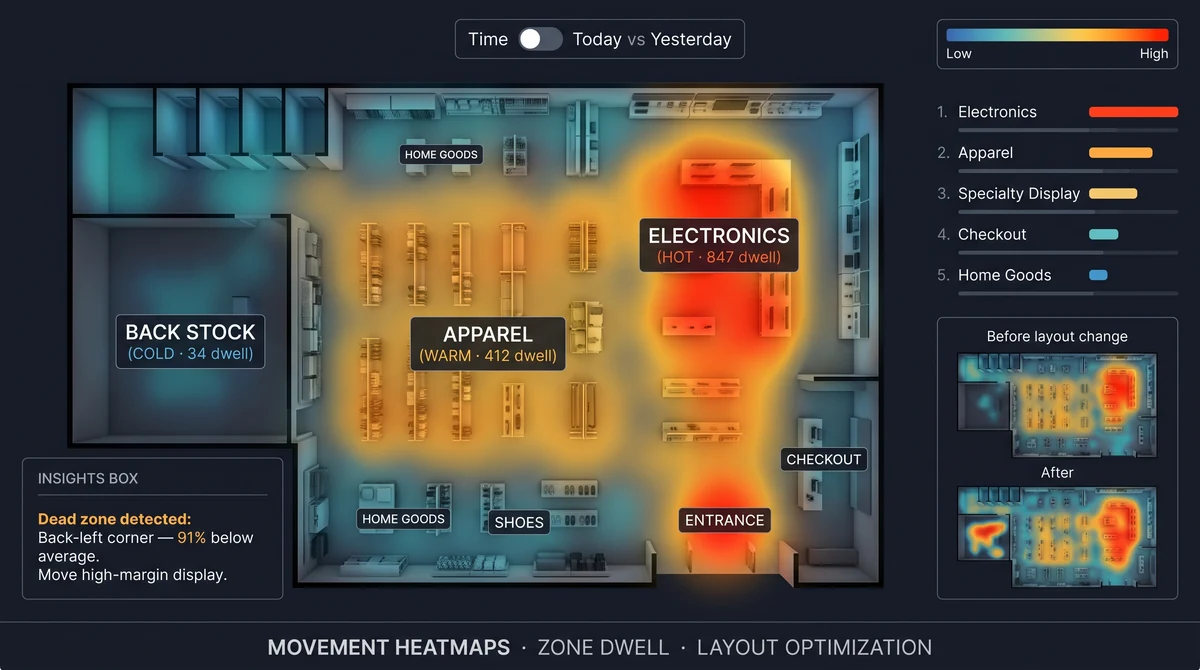
Movement heatmaps
See hot aisles, dead zones, and demo areas that attract or lose traffic.
Daypart breakdowns
Split footfall by opening hours, weekends, and festival seasons for staffing plans.
Conversion funnel proxies
Traffic → billing zone visits → POS transactions when integrations are enabled.
Traffic anomaly alerts
Notify ops when footfall drops sharply vs same day last week — possible closure or access issue.
Benchmark stores without clipboard counters
Manual footfall counts break down across 50+ outlets. Video-derived counts give consistent methodology whether the site is a Delhi NCR mall store or a tier-2 high street — critical for lease negotiations and campaign ROI.
Heatmaps reveal whether new layouts actually pull customers to high-margin sections — or create bottlenecks near billing.
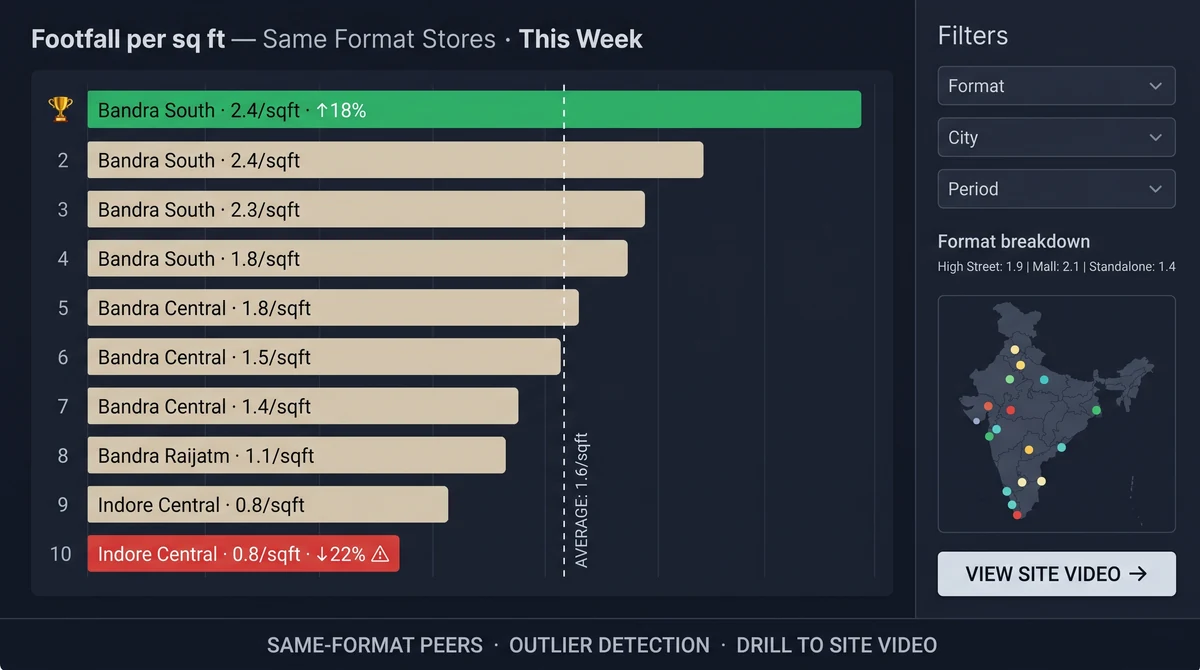
Regional league tables from the same camera stack
HQ compares footfall per sq ft, peak hour density, and billing-zone visit rates across cities. Underperformers get targeted interventions — staffing, signage, or format tweaks — with before/after charts.
Explore further
Industries served, use case playbooks, and platform modules that connect with Footfall & conversion analytics.
Where teams use this
Outcome playbooks
Works best with
See Footfall & conversion analytics on your cameras
Tell us about your sites and we'll show what Slinai surfaces on the CCTV you already own.
Common questions
How accurate is camera-based footfall?
Accuracy depends on camera height, angle, and lighting. We calibrate during onboarding and publish expected variance ranges per site.
Can footfall exclude staff or delivery personnel?
Optional classification filters reduce staff double-counts when cameras cover mixed traffic zones.
Does it work without POS?
Yes. Footfall and heatmaps run on video alone. POS integration adds transaction-based conversion metrics.
Can I export data to our BI tool?
Yes — via API and scheduled CSV exports in Data & integrations.
Talk to us — or see it live
Tell us about your sites and goals, and we'll show you exactly what Slinai surfaces on your existing cameras.
Book a live demo
A focused 30-minute session, tailored to your operation.
- Live walkthrough on footage like yours
- Your top use-cases mapped to detections
- Deployment plan for your cameras & sites
- Indicative pricing and ROI estimate
Or reach us directly